Tracing for Database Queries
In the previous lessons we learned how to manually instrument our application using the startSpan method. We also saw how we can add custom attributes (span metrics) to spans. Here’s a quick refresher:
import * as Sentry from "@sentry/node";
Sentry.startSpan({  name: "my.span",  op: "my.operation",  attributes: {    "my.attribute": "value"  }}, () => {  ...});
The great thing about Sentry is that it automatically instruments many common libraries and frameworks, including PostgreSQL in our application. This helps us identify all sorts of performance bottlenecks caused by database queries.
Learning Objectives
By the end of this module, you will:
- Instrument database queries with detailed performance metrics
- Search for and analyze database query performance in Sentry
- Identify slow queries and optimization opportunities
- Understand query patterns through Sentry’s trace data
Database Query Instrumentation
If we just open any trace of the / page, we can see that all the database queries are instrumented and we can see the performance metrics for each query:
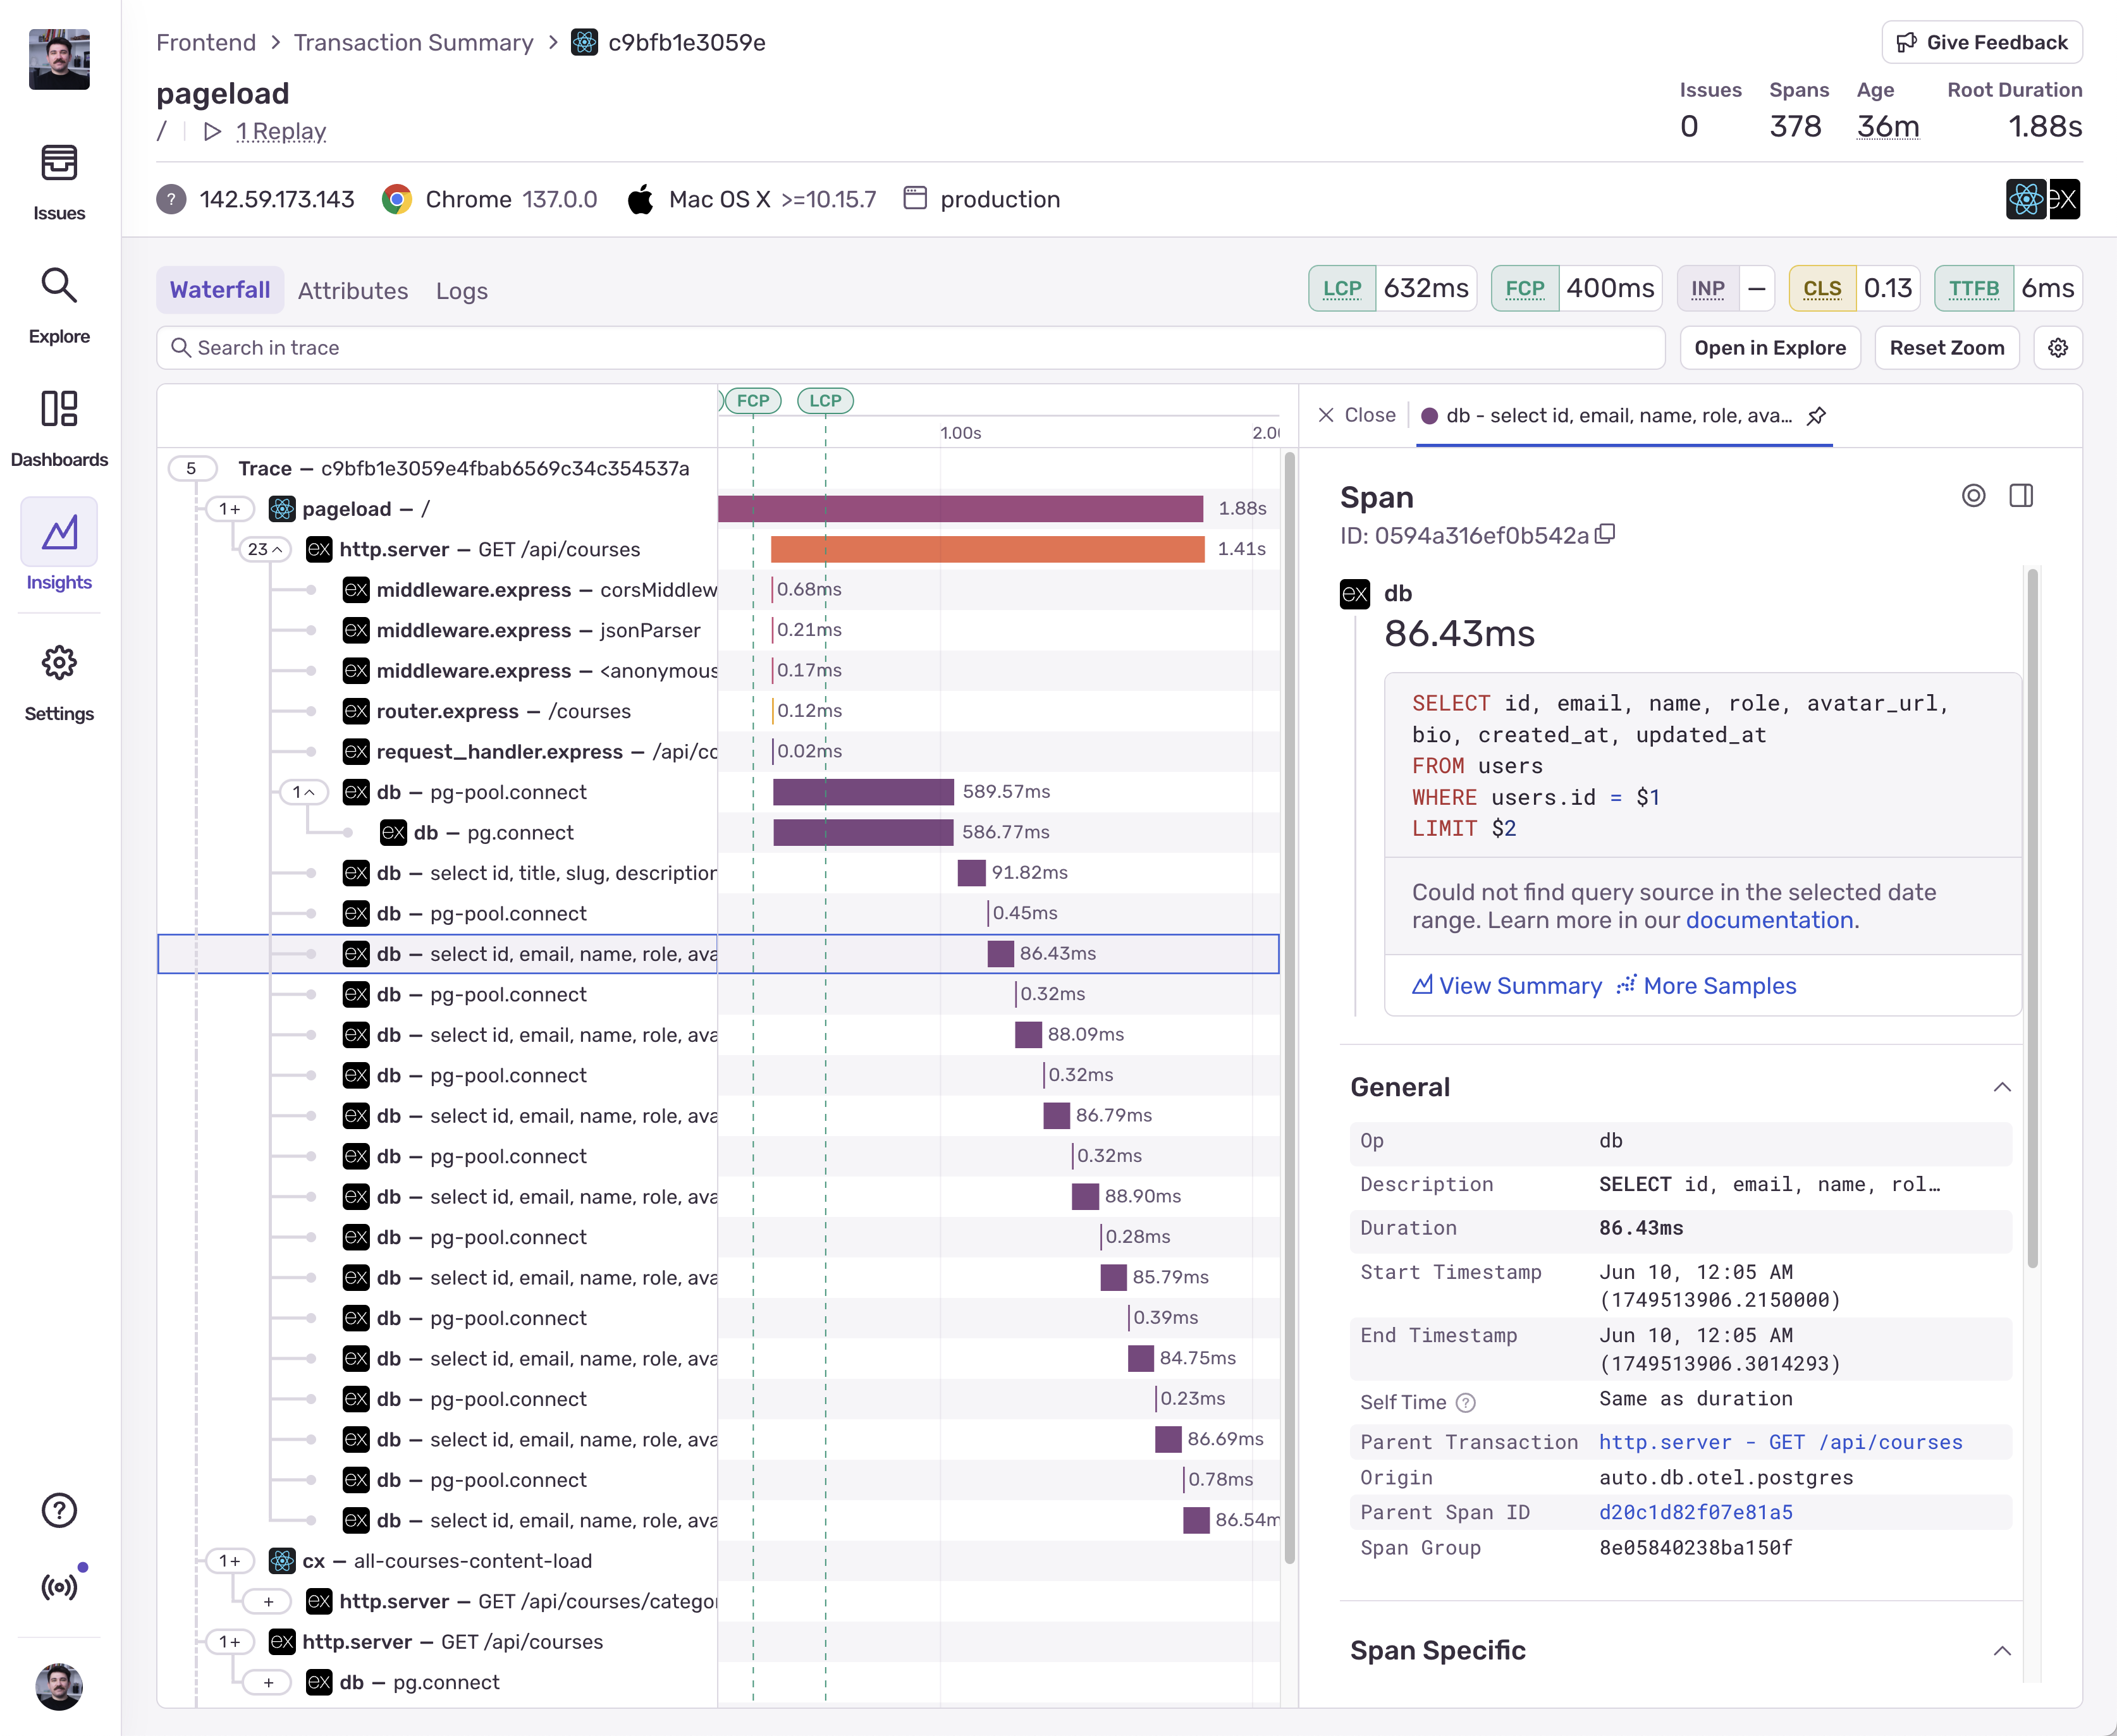
yikes
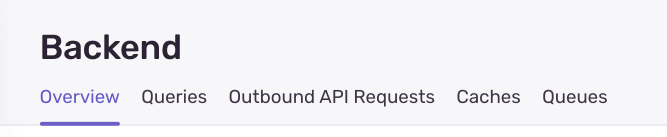
If we go to the Insights > Backend page, we’ll see Queries, among Outbound API Requests, Queues, and Caches tabs:
These pages use the tracing data we send to Sentry, filter only the spans that are related to queries, queues, and caches, and analyze the data to help us identify performance bottlenecks in those areas. Here’s what the Queries page give us:
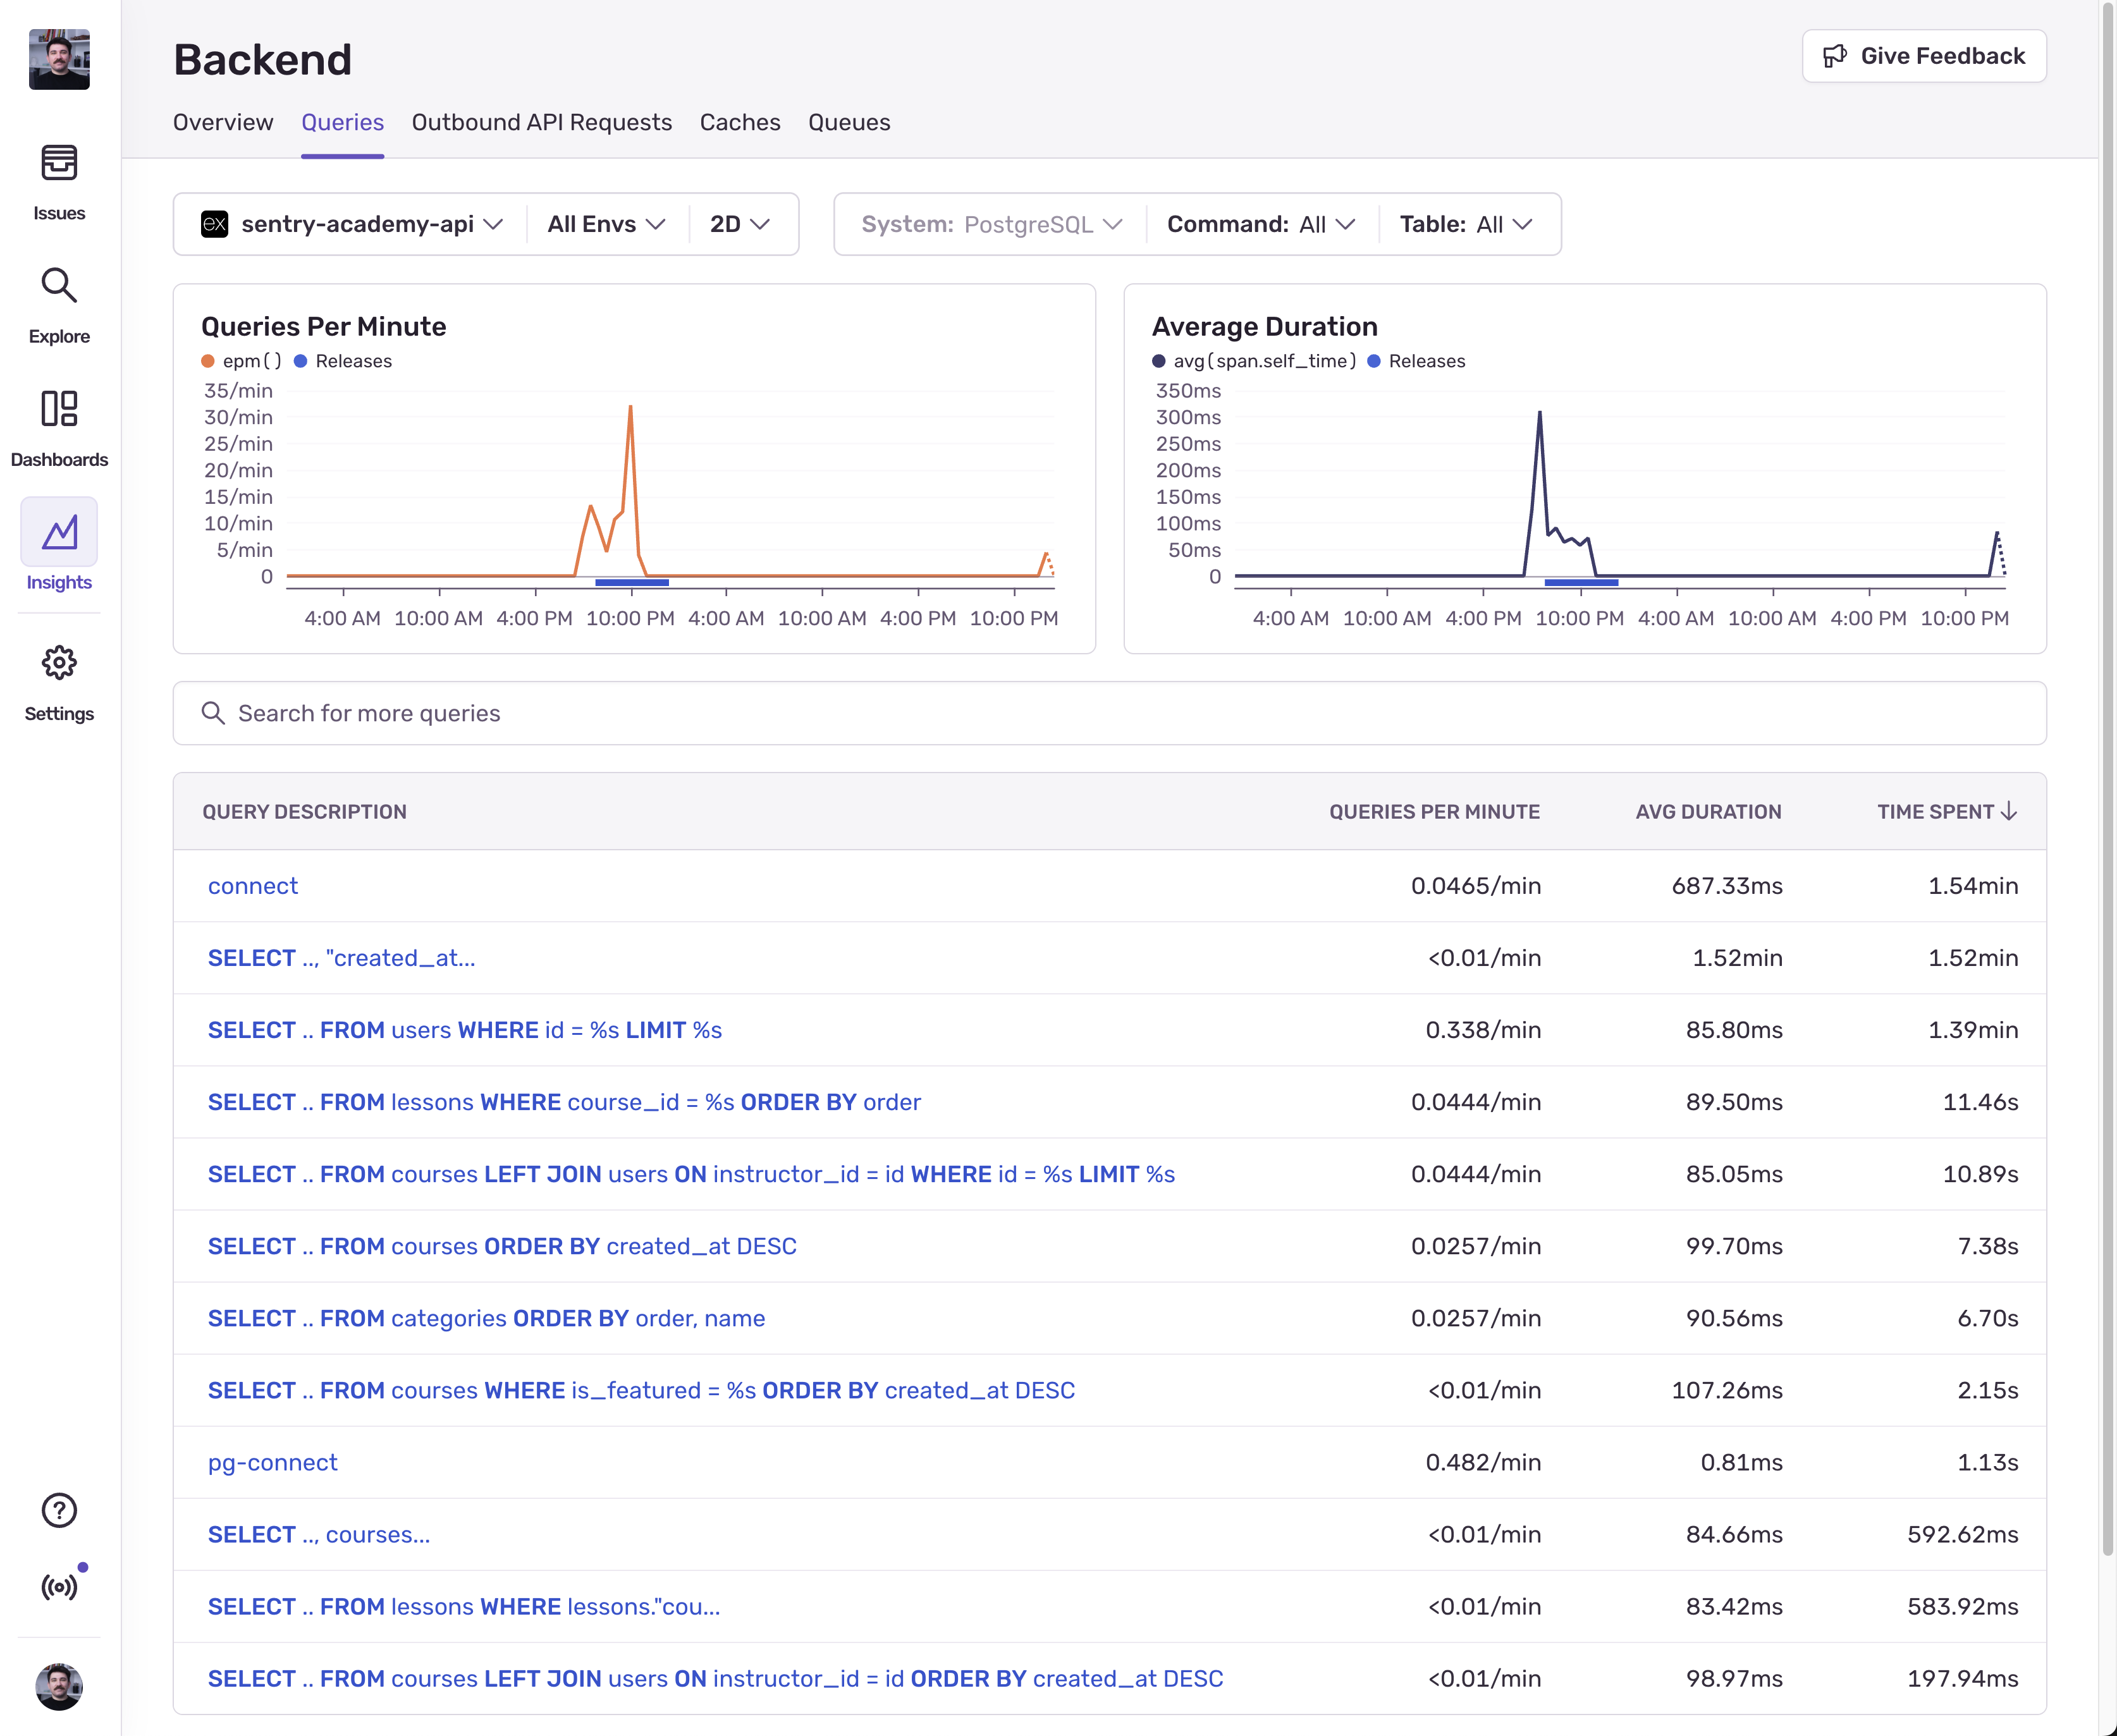
Looking at the list of queries, we can see that we’re spending the most time executing pg.connect, followed by 7 different SELECT queries, and so on.
The “Queries Per Minute” column shows us how many queries are being executed per minute, so the connect query having the most queries per minute tells us that we might have a problem with how we establish connections to the database.
To debug this further, we can click into the queries and see where they are being executed from, what’s the actual raw SQL query that gets executed, and look at some traces that contain the query.
Manually instrumenting database queries
Sentry is focused on implementing auto-instrumentation for common libraries and frameworks, but there are cases where the library you use is not supported by Sentry. Manual instrumentation to the rescue!
Instrumenting a database query is not very different than instrumenting any other operation. We’re still using the startSpan method to wrap a database query with a span, but in order for that span to be considered a database query span, we need to correctly set the span information:
- The span
opfield should be set to an eligible value (ex.db,db.query,db.sql.executeand so on) - The span
namefield must contain the full, parametarized SQL query (ex."SELECT * FROM courses WHERE id = ?") - The span must have a
db.systemattribute set to the correct identifier (ex."postgresql")
So, the code to manually instrument a database query would look like this:
import * as Sentry from "@sentry/node";
Sentry.startSpan({  name: "SELECT * FROM courses WHERE id = ?",  op: "db.query",  attributes: {    "db.system": "postgresql"    // we can even add more attributes that can help us debug the query    "db.name": "courses",    "db.user": "neondbuser",  }}, () => {  // invoke the database query});
Since we’re using Drizzle ORM, we don’t really write raw SQL queries like above, so we’d need to convert the query to raw SQL before executing it, and that would look like this:
import * as Sentry from "@sentry/node";
// Write query without awaitconst query = db .select() .from(categories) .orderBy(categories.order, categories.name);
// Convert query to raw SQLconst rawSQL = query.toSQL();
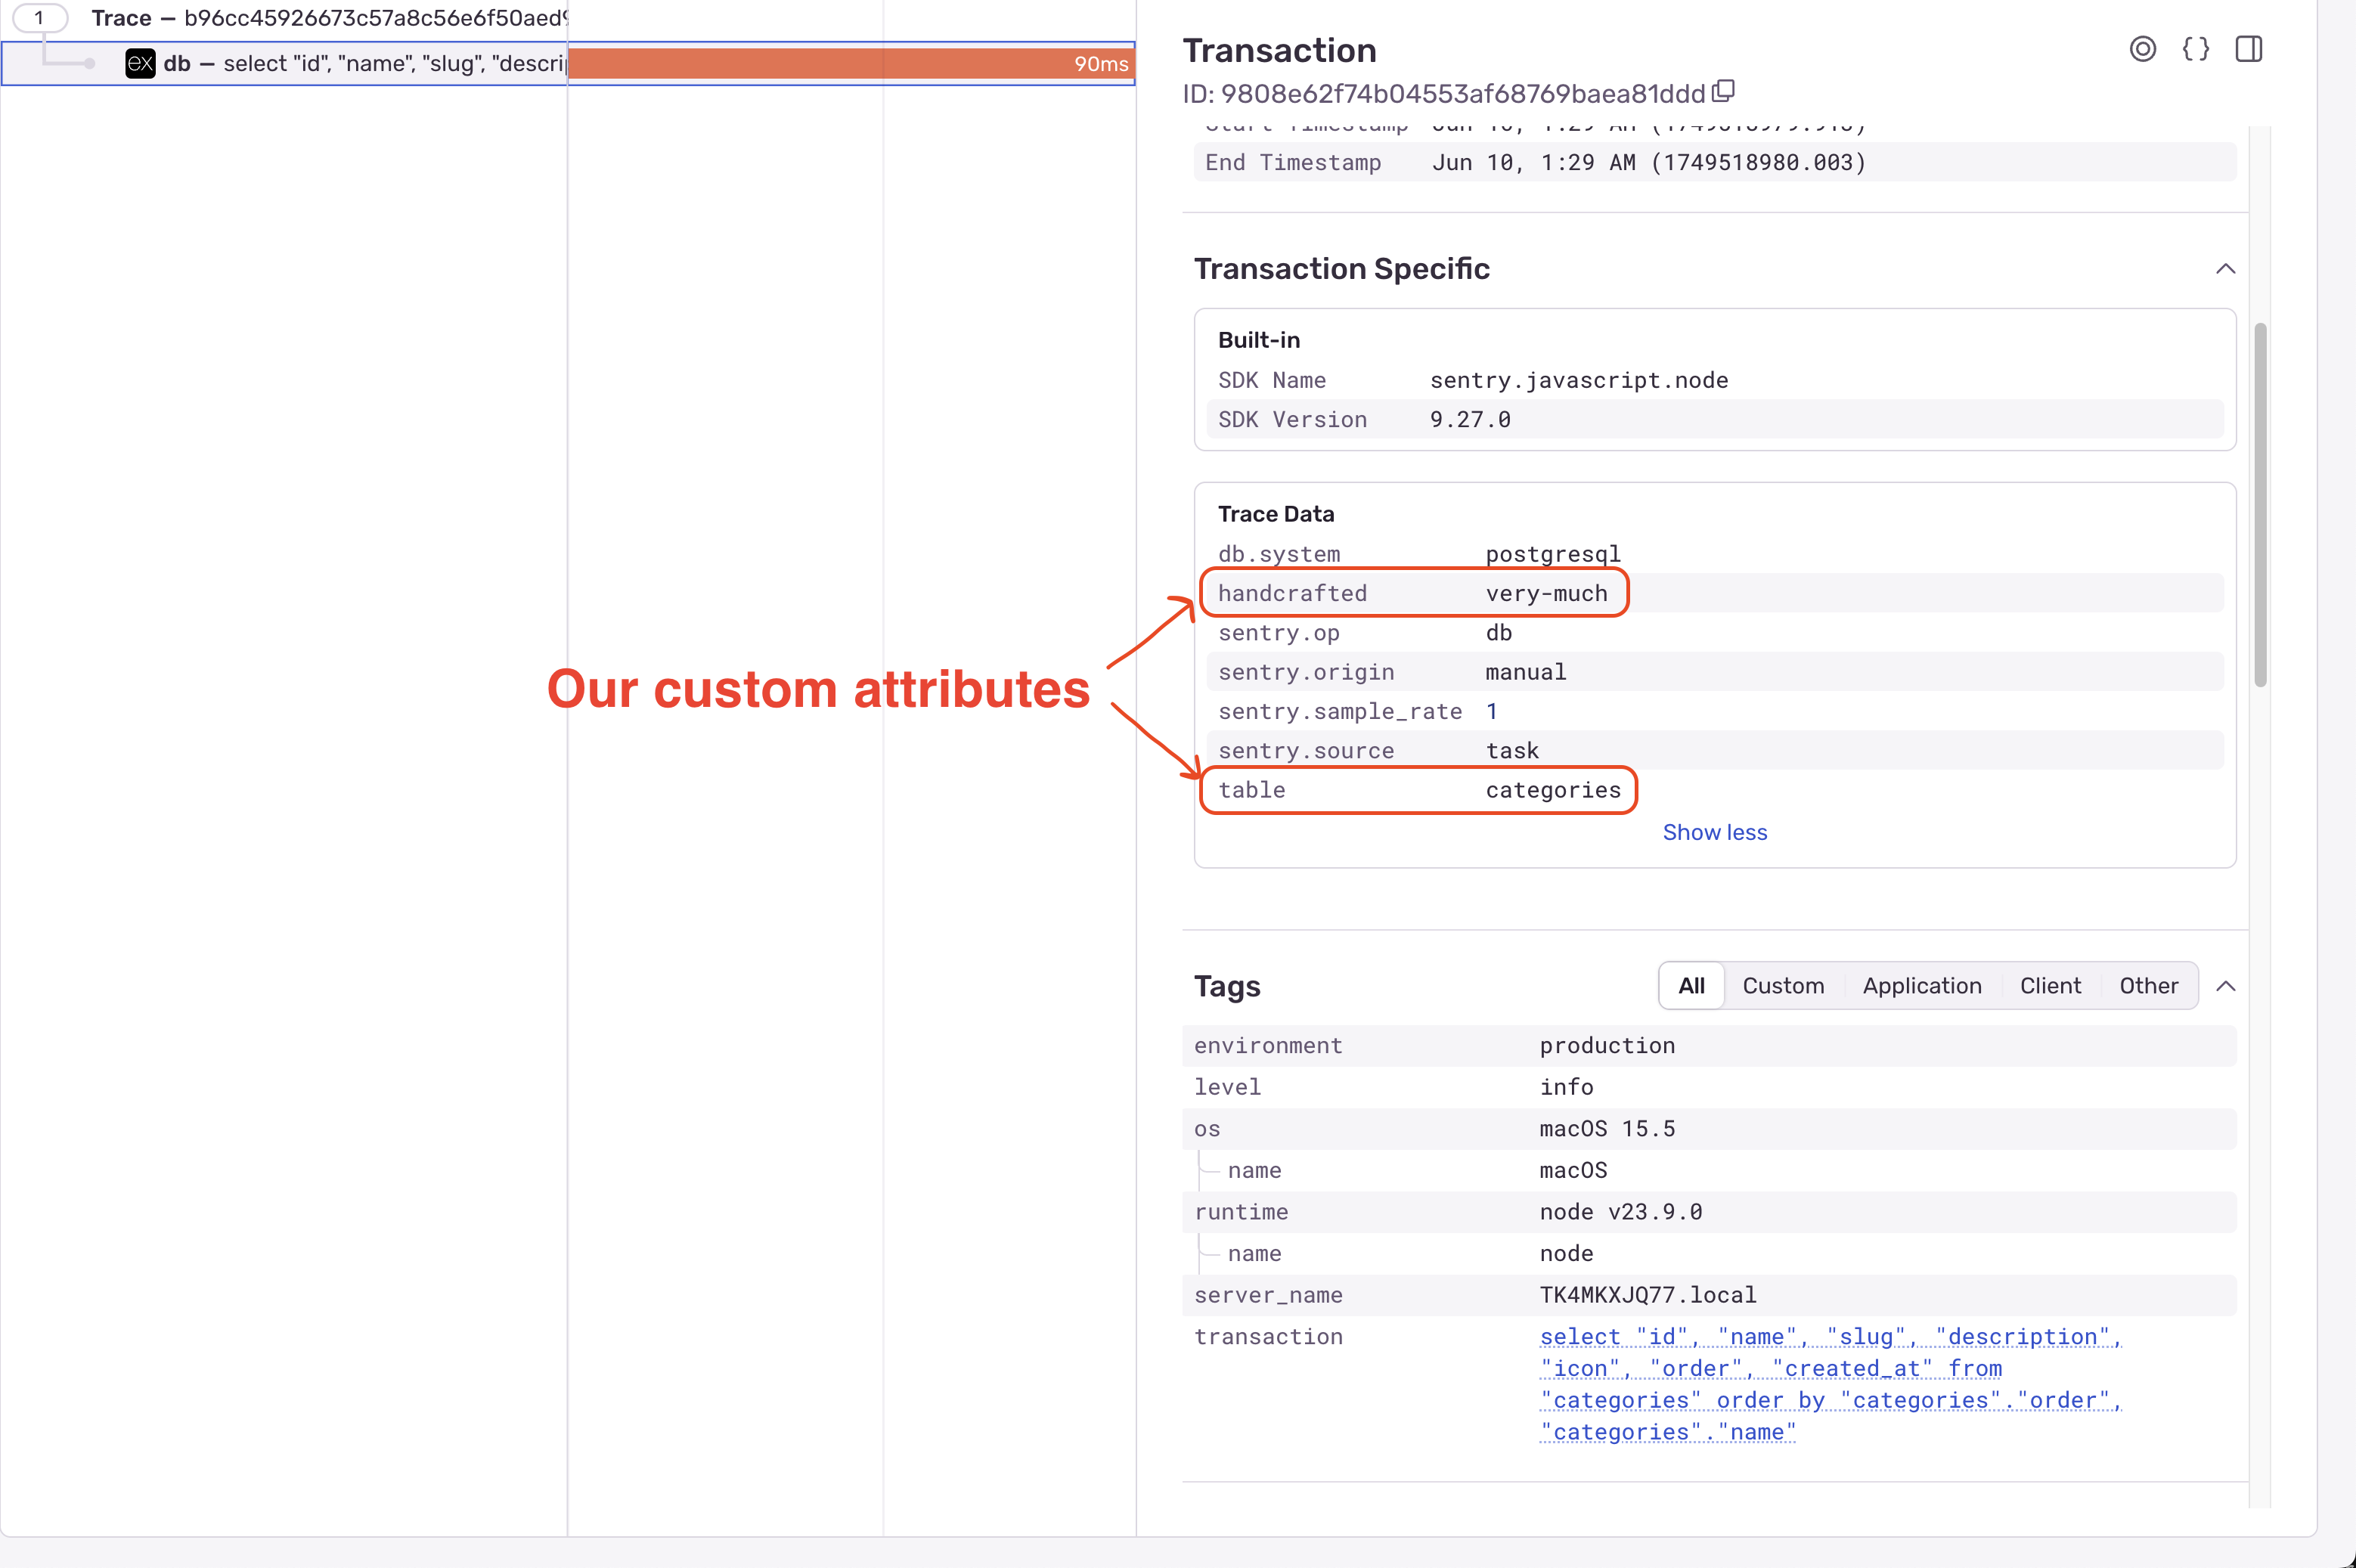
// Wrap the execution with a span with correct name, op, and attributesconst categoryList = await Sentry.startSpan({ name: rawSQL.sql, op: "db", attributes: { "db.system": "postgresql", table: "categories", handcrafter: "very-much", }}, () => query);This is basically what Sentry’s SDKs do for us under the hood when they auto-instrument our database queries. This span is correctly implemented as a database query span, so it will show up in the Insights > Backend > Queries page, and we can see the performance metrics for it.
Here it is in the trace:
And here it is in the Insights > Backend > Queries page:
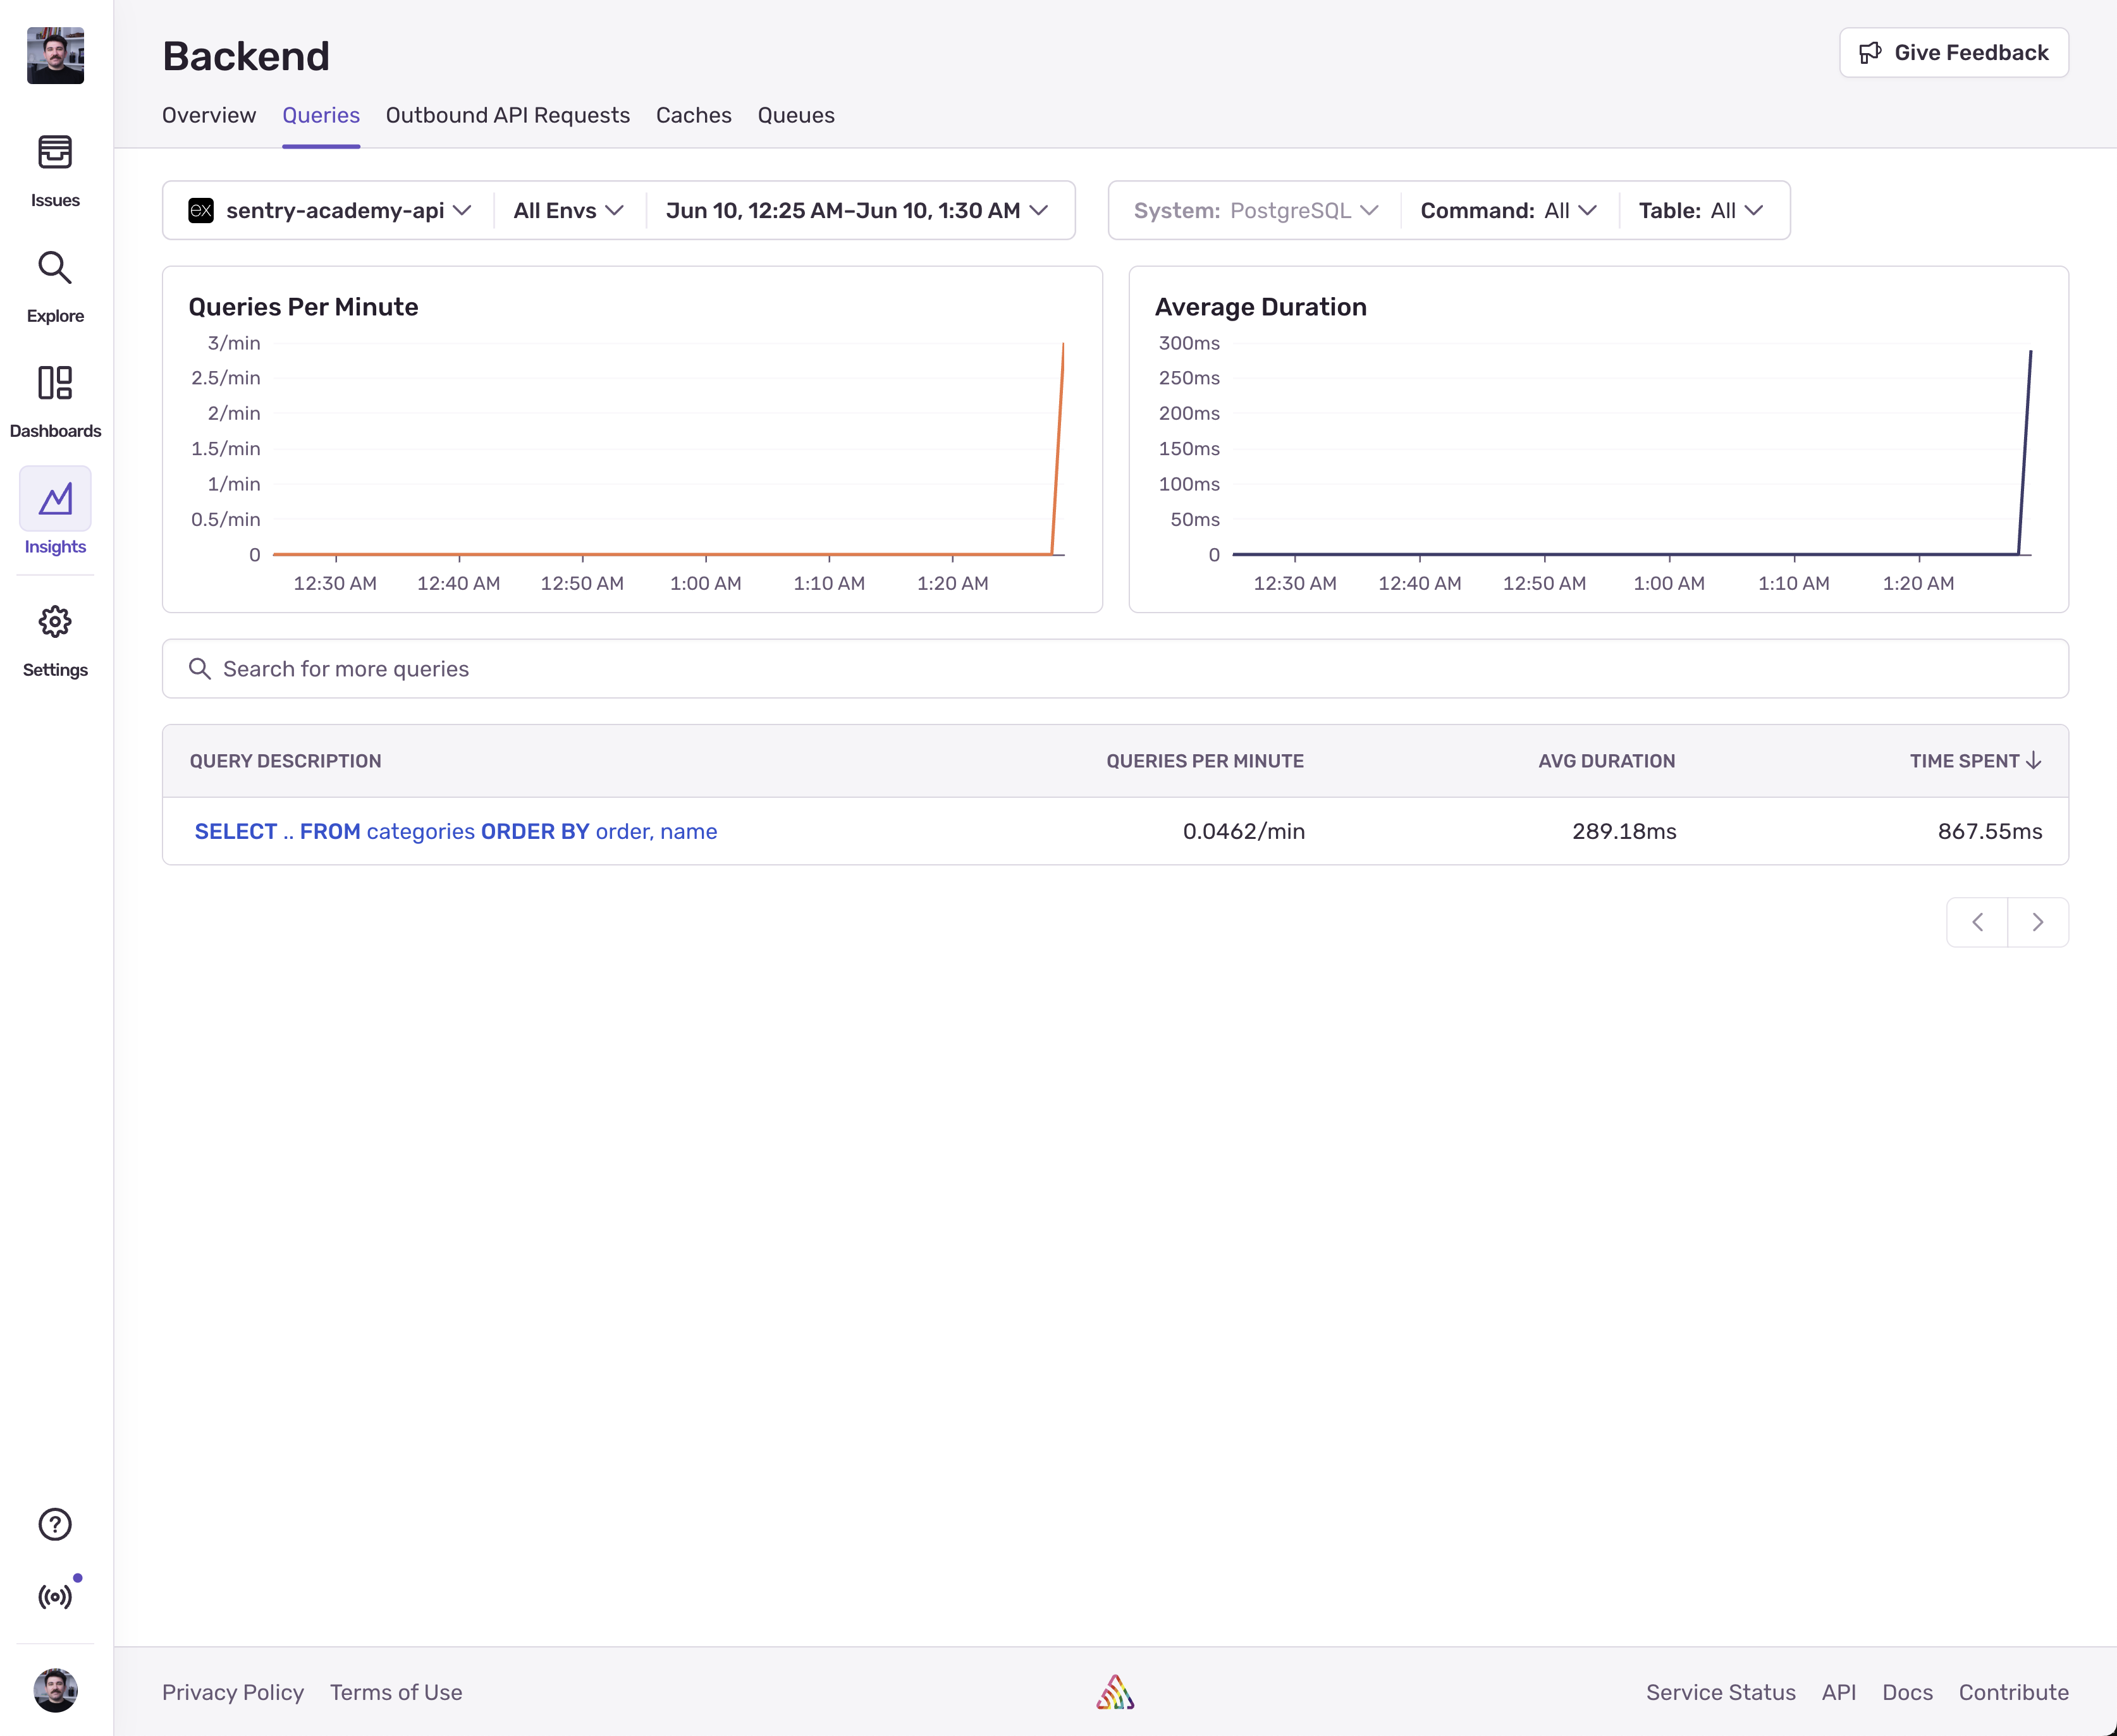
Now since we got it instrumented, we can aggregate it in the Trace Explorer, create alerts on it, and so on.
Not just Queries
Now we know how to instrument database queries. In a very similar way, we can also instrument queues and caches. To learn more about that, check out:
Bottom line is, Sentry is looking for specific names, operations, and attributes to identify database queries, queues, and caches. As long as we follow the instrumentation guidelines, we can instrument any database, message queue, or cache store.
Next Steps
With your data layer fully instrumented, move on to Monitoring Critical Experiences to learn how to create dashboards that track business-critical user flows and experiences.