Monitoring Critical Experiences
Now that you’ve learned how to instrument your application, it’s time to tie everything together and focus on the experiences that matter most. Critical Experiences are specific user flows that are business-critical - every error or performance issue in these flows will negatively impact your business success.
Learning Objectives
By the end of this module, you will:
- Understand what Critical Experiences are and why they matter
- Learn how to identify and define Critical Experiences for your application
- Set up comprehensive dashboards to monitor Critical Experiences using Sentry
- Create widgets that track errors, performance metrics, and custom business metrics
What are Critical Experiences?
Critical Experiences (CX) are specific user journeys or workflows that directly impact your business outcomes. Unlike general application monitoring, Critical Experience monitoring focuses on the end-to-end user flows that drive revenue, user engagement, and business growth.
Examples of Critical Experiences
E-commerce Application:
- User registration and onboarding
- Product search and discovery
- Add to cart and checkout process
- Payment processing
- Order confirmation and tracking
SaaS Platform:
- User signup and trial activation
- Core feature usage (dashboard loading, data processing)
- Subscription management
- Billing and payment flows
Content Platform:
- Content discovery and search
- Content consumption (video playback, article reading)
- User engagement actions (likes, shares, comments)
- Subscription or premium feature access
Why Monitor Critical Experiences?
Traditional monitoring focuses on technical metrics like server response times and error rates. Critical Experience monitoring connects these technical metrics to business outcomes by:
- Business Impact Focus: Prioritizes issues that directly affect revenue and user satisfaction
- End-to-End Visibility: Tracks complete user journeys across multiple services and touchpoints
- Proactive Problem Detection: Identifies degradation before it significantly impacts business metrics
- Contextual Alerting: Provides alerts with business context, making it easier to prioritize responses
Sentry Academy Critical Experience Setup
Our Critical Experience encompasses the following key touchpoints:
- Authentication Flow: User login and account access
- Homepage Experience: Platform overview and course discovery
- Courses List: Course browsing and selection
- Course Detail: Individual course information
Each touchpoint has specific metrics we need to monitor to ensure optimal user experience.
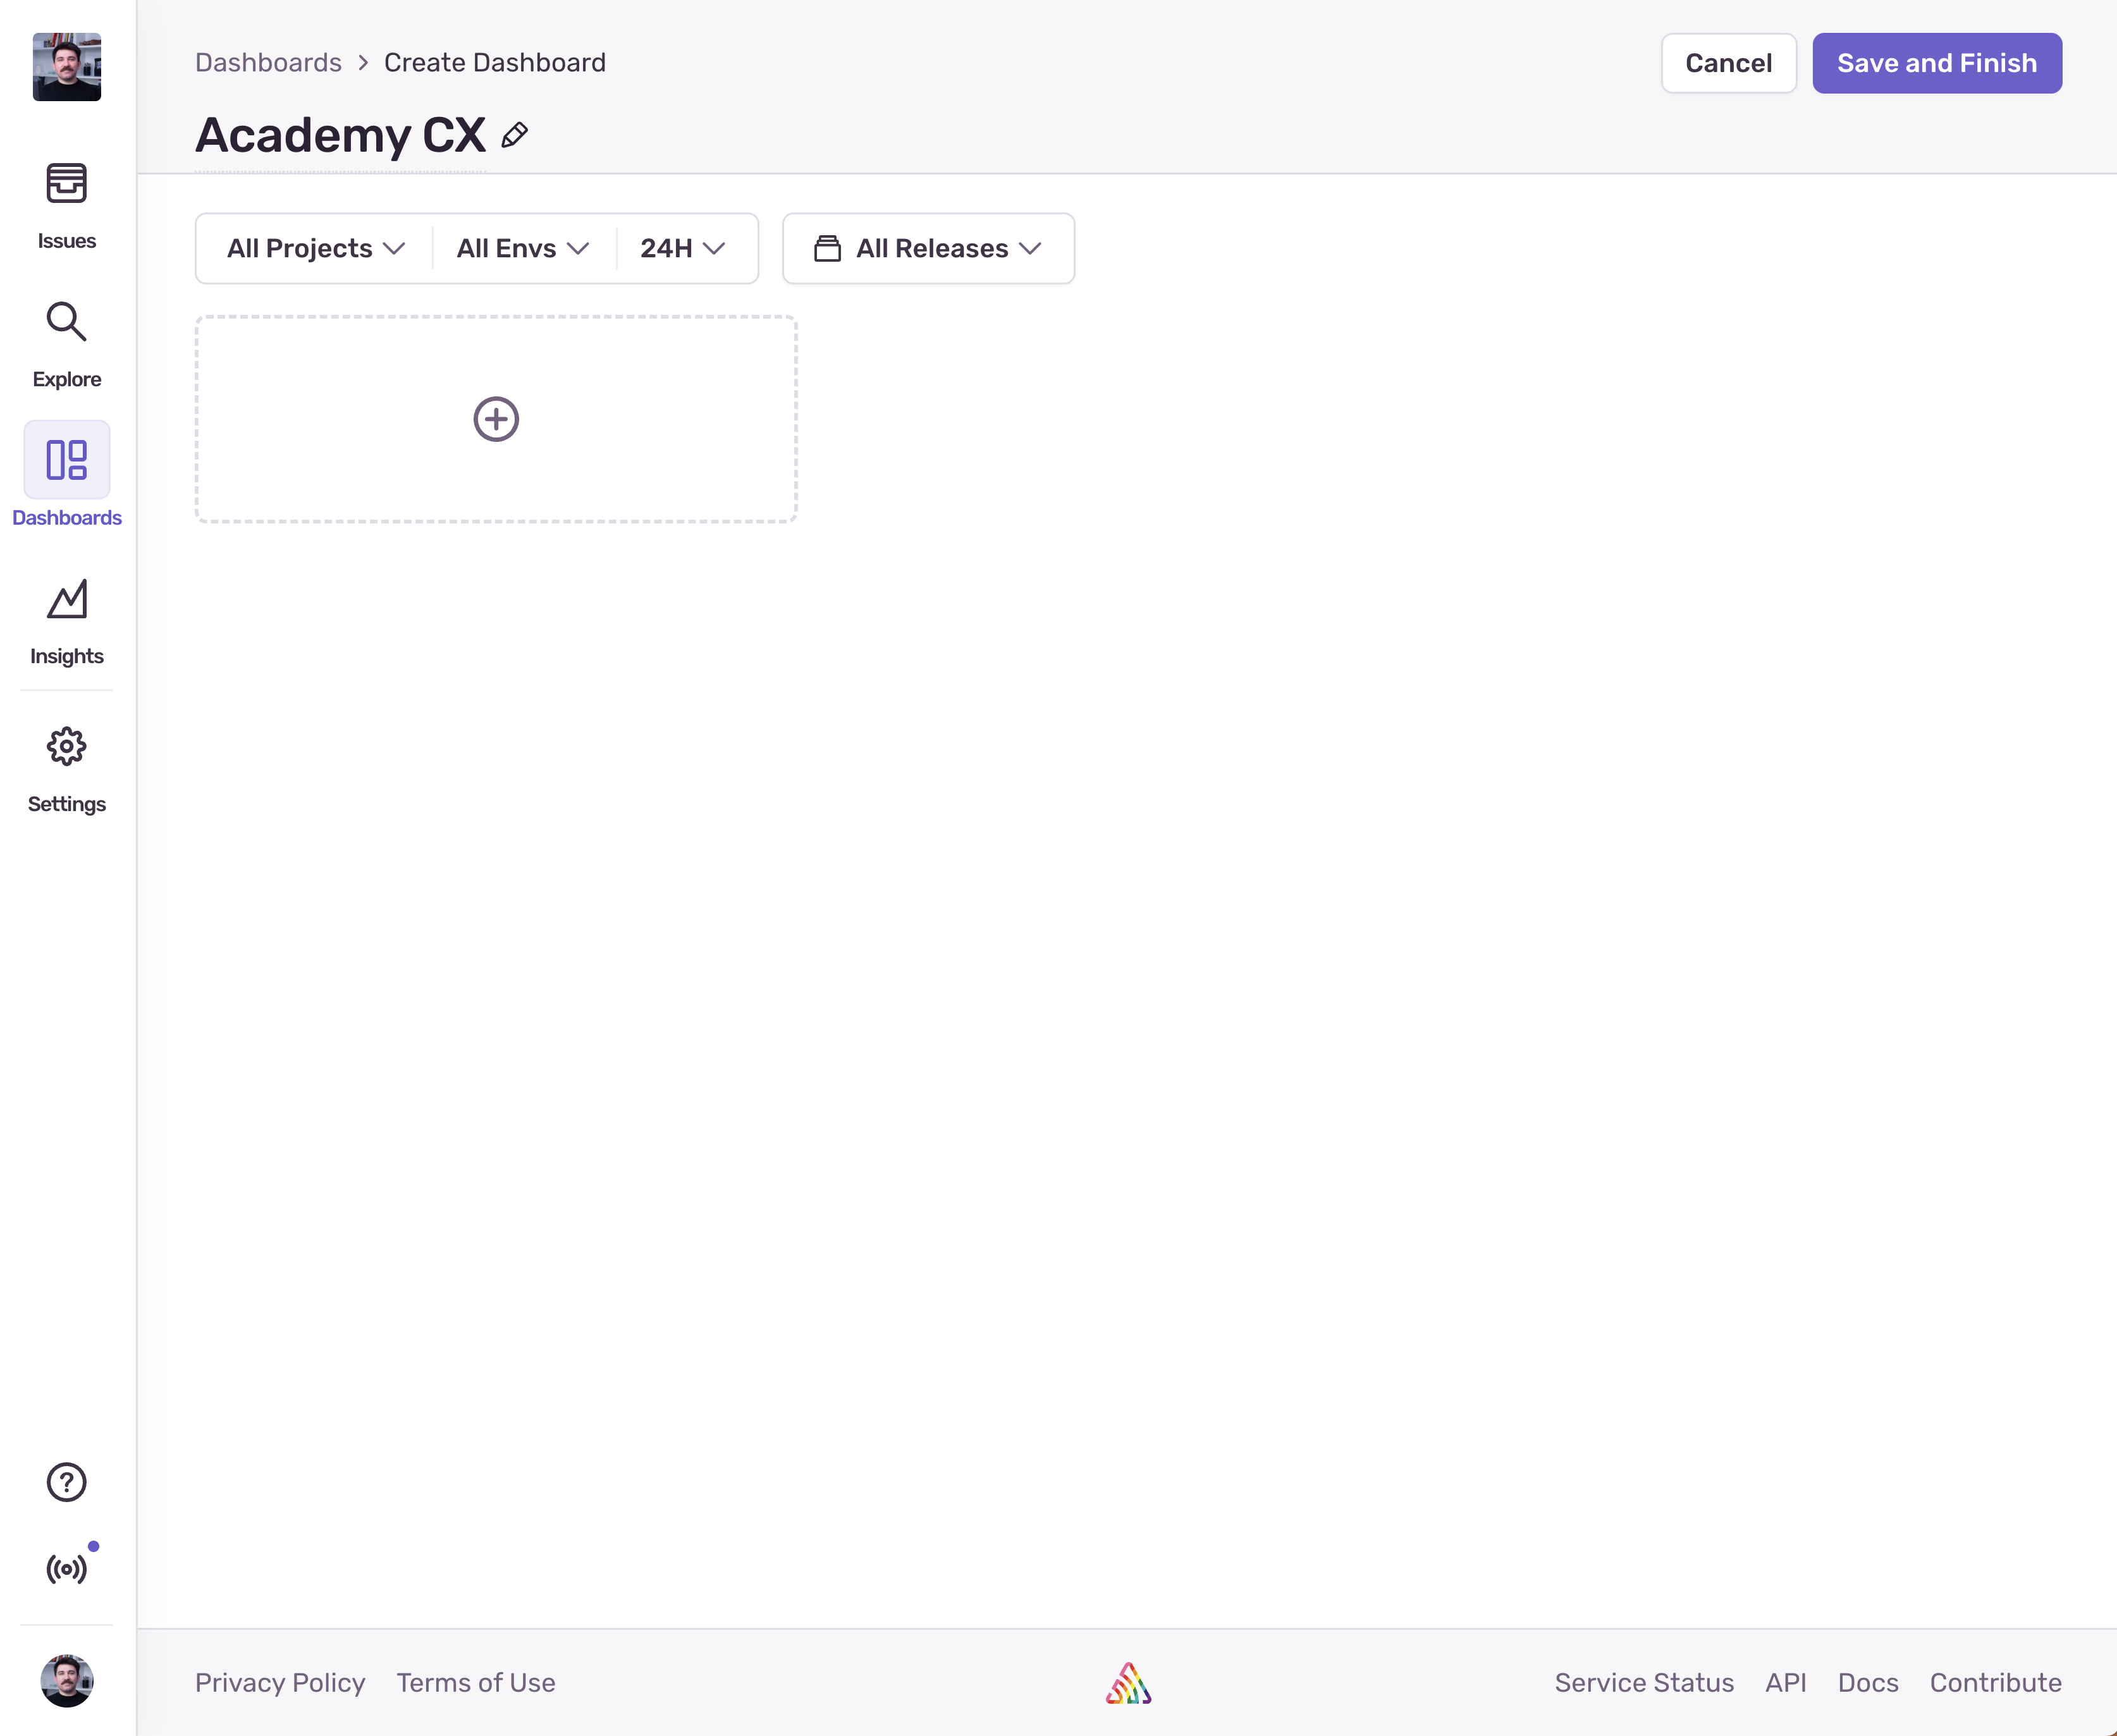
Before we get started, let’s make sure that we have the dashboard created and that we’re logged in. Navigate to the Dashboards page in Sentry and create a new one. Name it as you want. I’ll name it “Academy CX”. Don’t forget to click on the “Save and Finish” button to create the dashboard.
1. Authentication Flow Monitoring
The authentication flow is critical because users who can’t log in can’t access any platform features. We need to monitor both the technical performance and business impact of authentication issues.
For this step we’ll just have one widget that tracks the error rate on the /login page. Before we do that, we need to make sure that errors happening on that page are being reported to Sentry. Let’s locate the login function in the AuthContext.tsx file and add a Sentry.captureException call to it:
const login = async (email: string, password: string): Promise<void> => { ... try { ... } catch (error: any) { Sentry.captureException(error); // Add this line }};With this in place, we can go ahead and create our first widget. Navigate to the newly created dashboard and click on the “Add Widget” button:
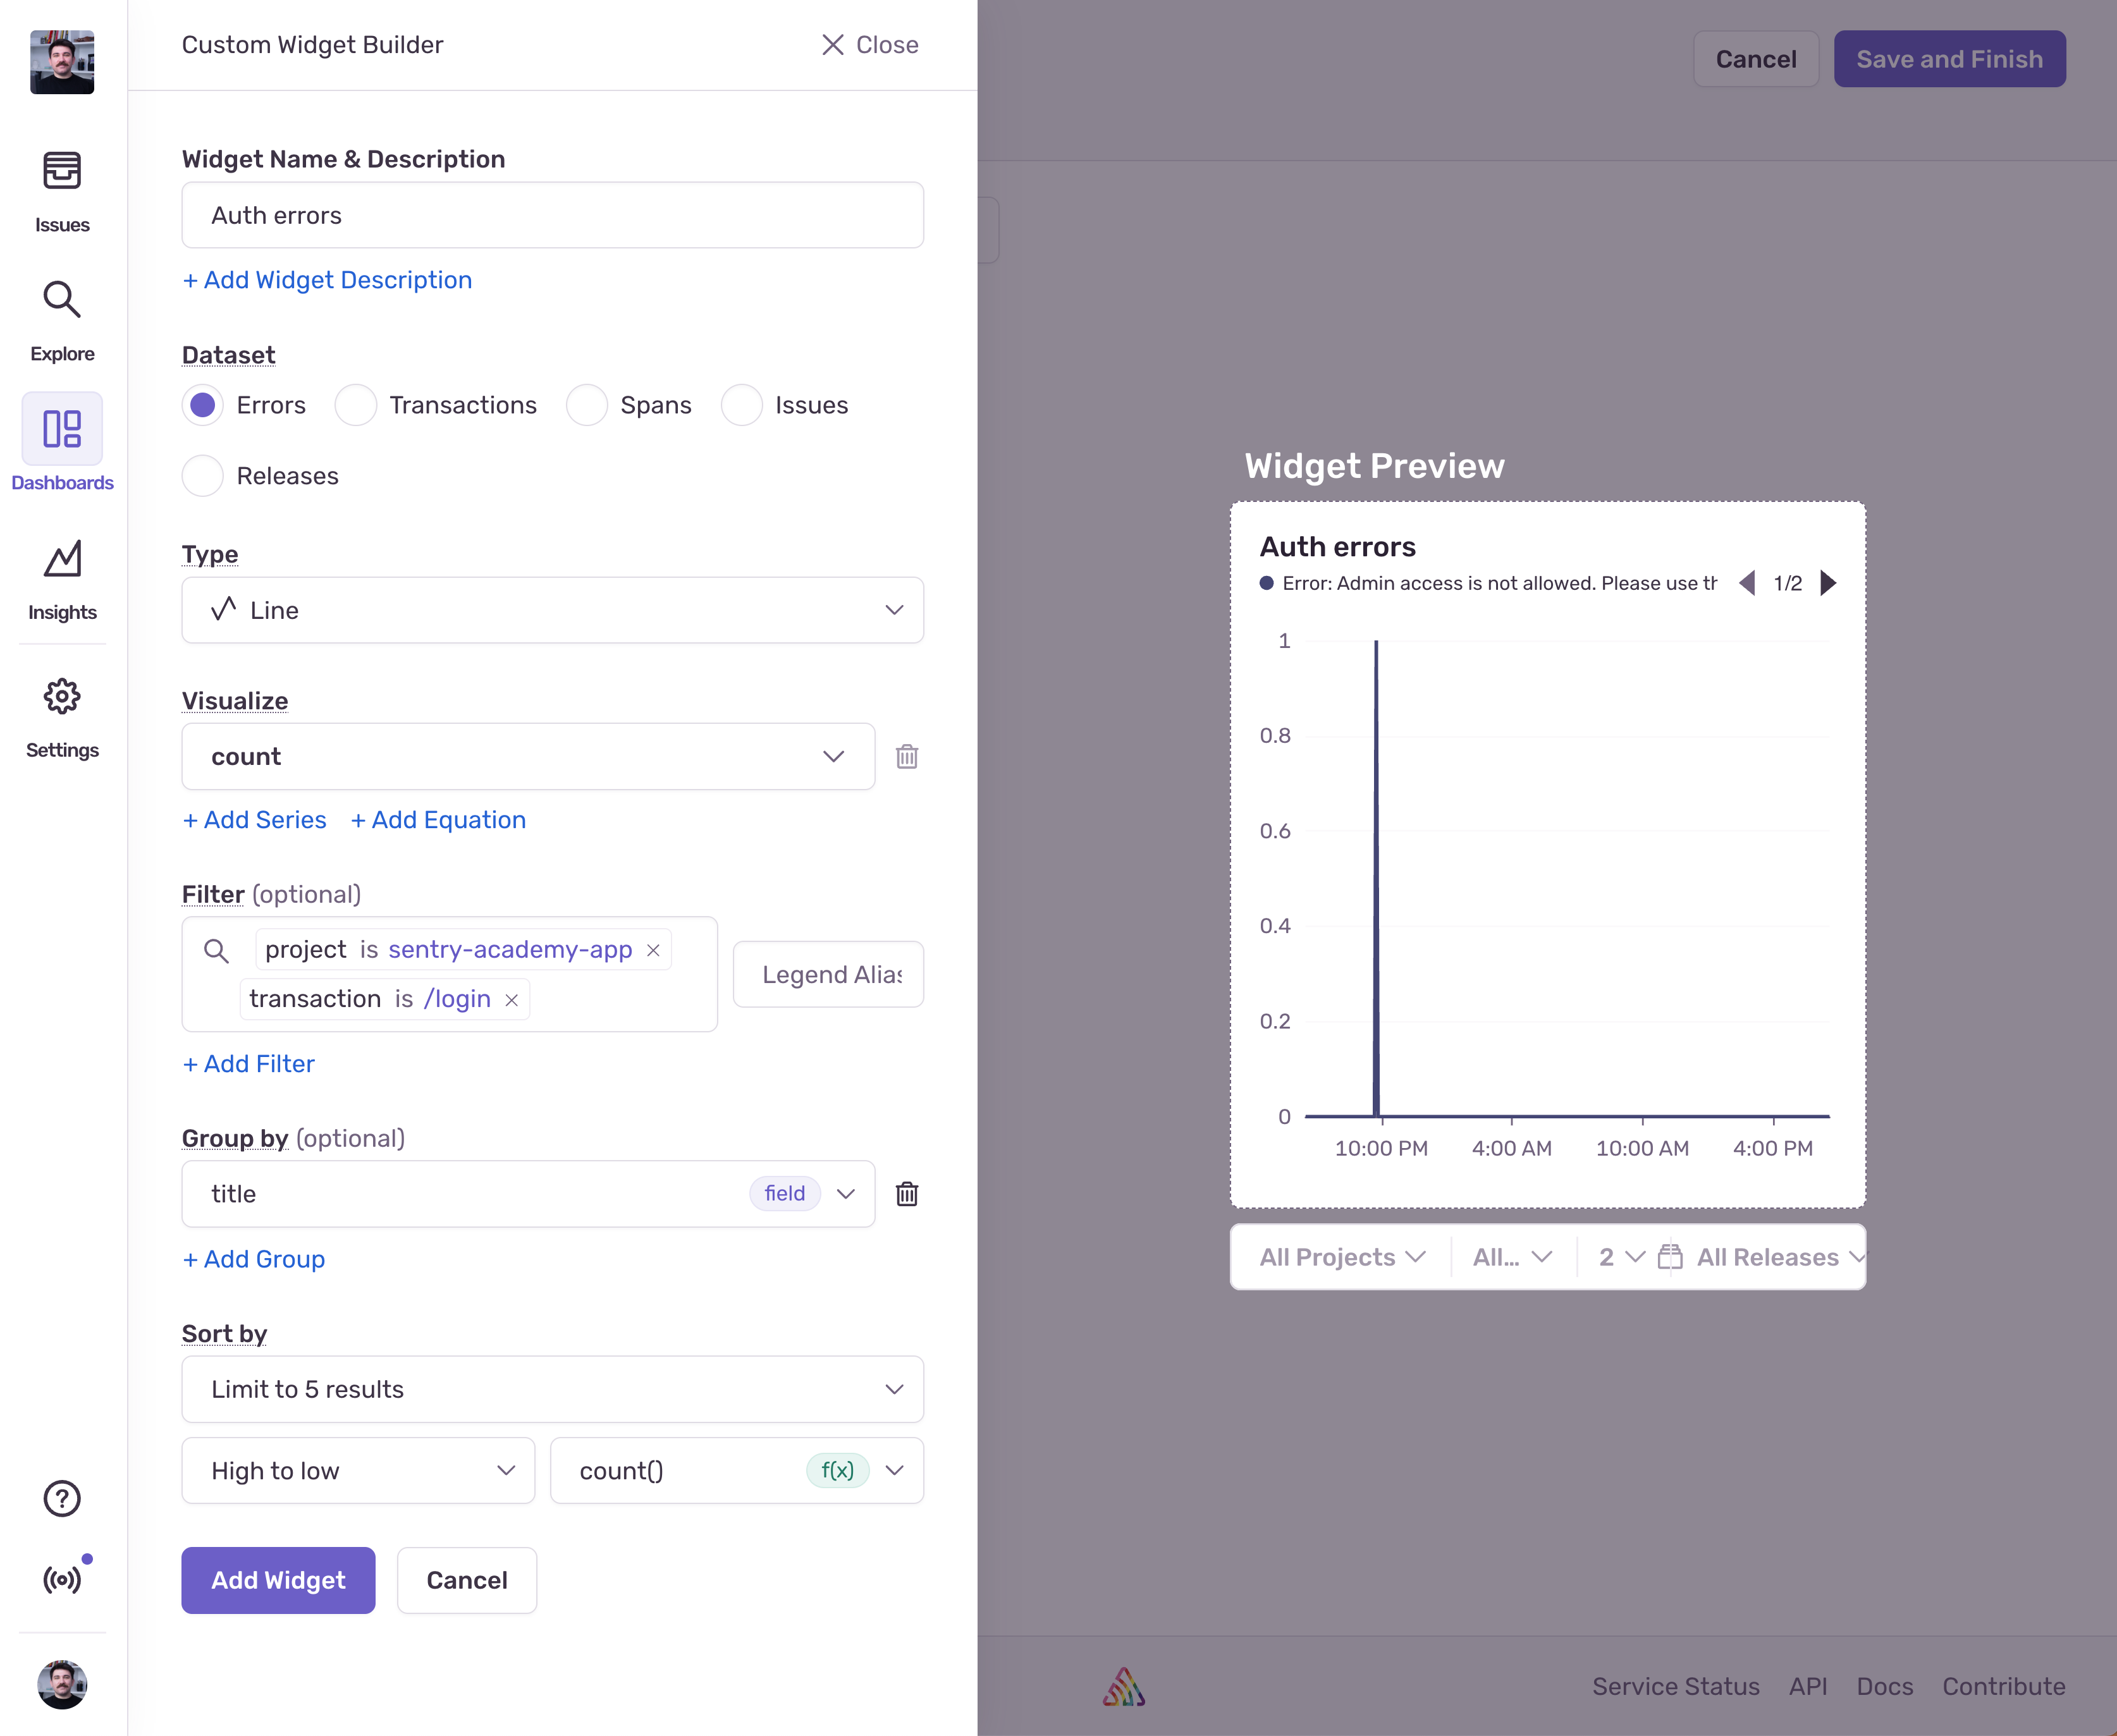
- Set the name of the widget to something like “Auth Errors”
- Make sure the Dataset is set to “Errors”
- Leave the type as “Line”, or you can also try “Bar”
- Set the visualization to “count”
- Set the filter to
project is sentry-academy-appandtransaction is /login - Set the group by to “title”
That’s it! Hit “Add Widget” and you should see the widget appear on your dashboard. If you want, you can click “Edit Dashboard” and drag the widget to take up all the width of the dashboard. Now if we go back to the login page and try to log in with admin@sentry.io we should cause an error and see it in the widget.
2. Homepage Experience Monitoring
The homepage is often the first impression users have of your platform. Poor homepage performance can lead to immediate user abandonment and reduced engagement. Let’s set up a couple of widgets to monitor the performance and errors on the homepage.
-
Homepage Load Time Monitoring
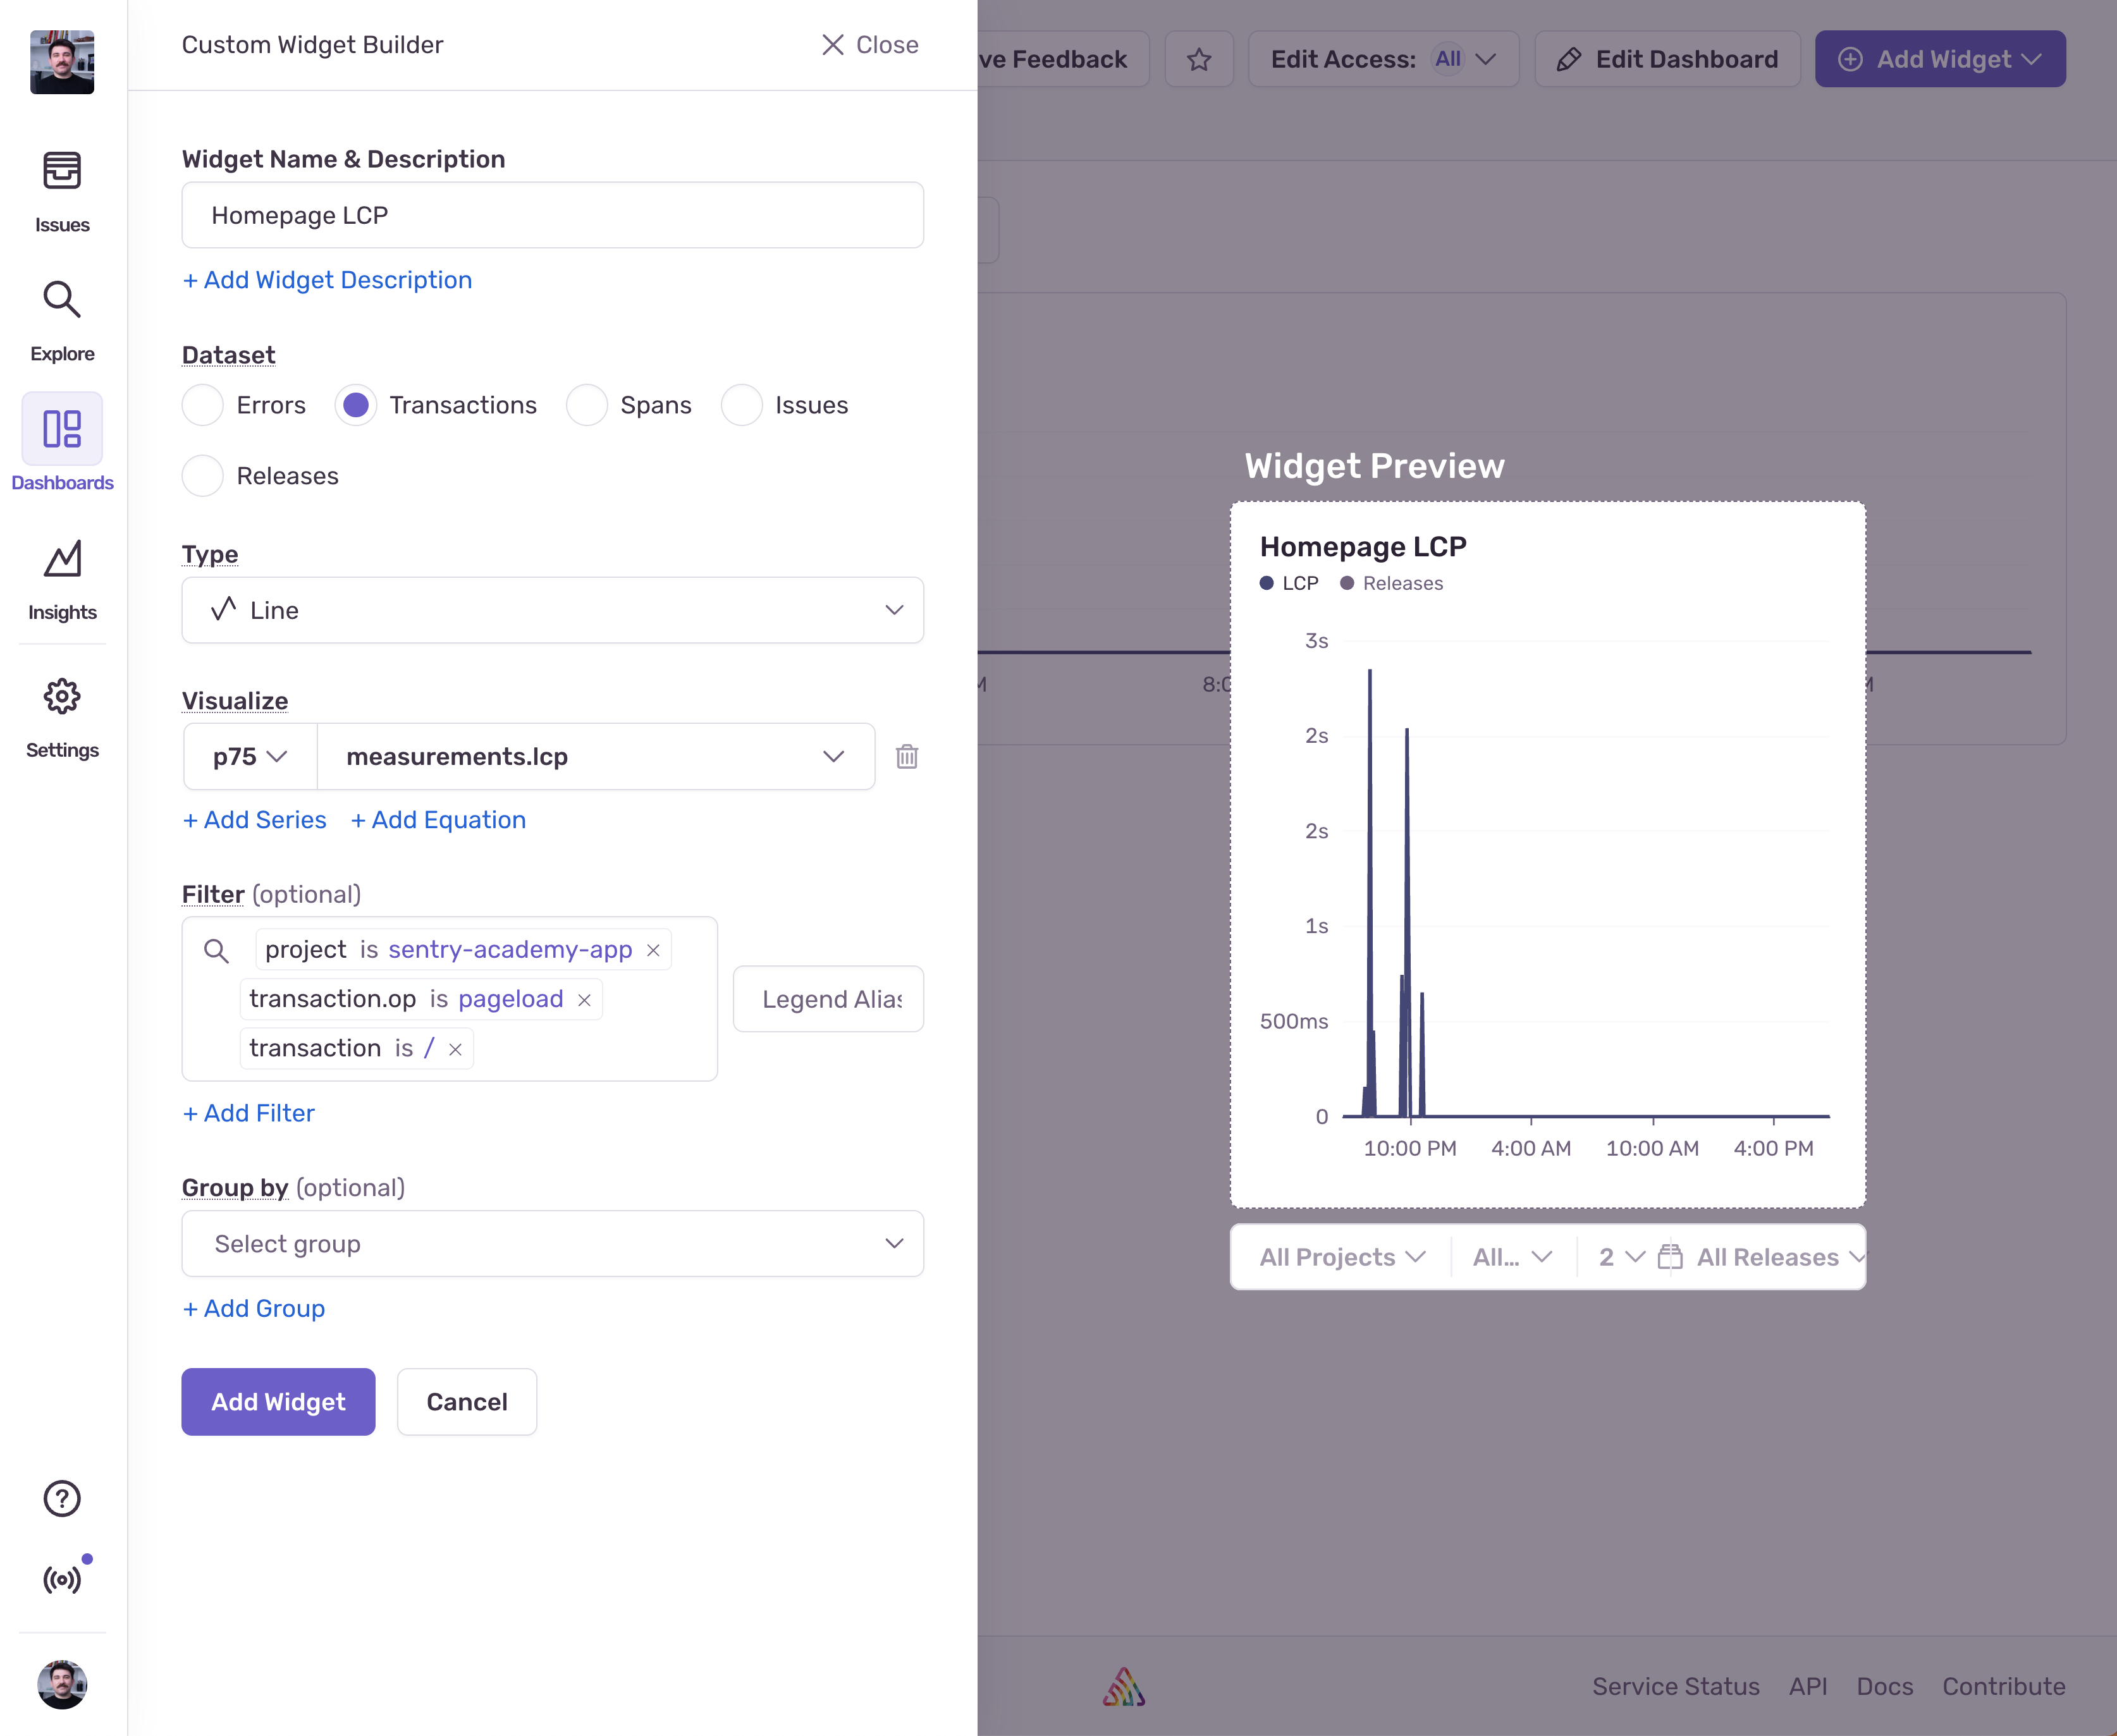
To monitor the pageload, we can either track the p75 of the transaction duration for homepage loads, or the LCP (Largest Contentful Paint) metric. Let’s do LCP on the homepage:
- Set the name of the widget to something like “Homepage LCP”
- Make sure the Dataset is set to “Transactions”
- Leave the visualization to “Line”
- Set the visualization to
p75andmeasurements.lcp - Set the filter to
project is sentry-academy-app,transaction.op is pageload, andtransaction is /
This will give us a line chart widget that shows the p75 value of the homepage LCP metric over time.
If you want to track the p75 of the transactions durations for homepage loads, you can just switch the visualization to
p75andtransaction.duration. -
Homepage Error Tracking
Similarly to the previous error widget, we can track the error rate on the homepage:
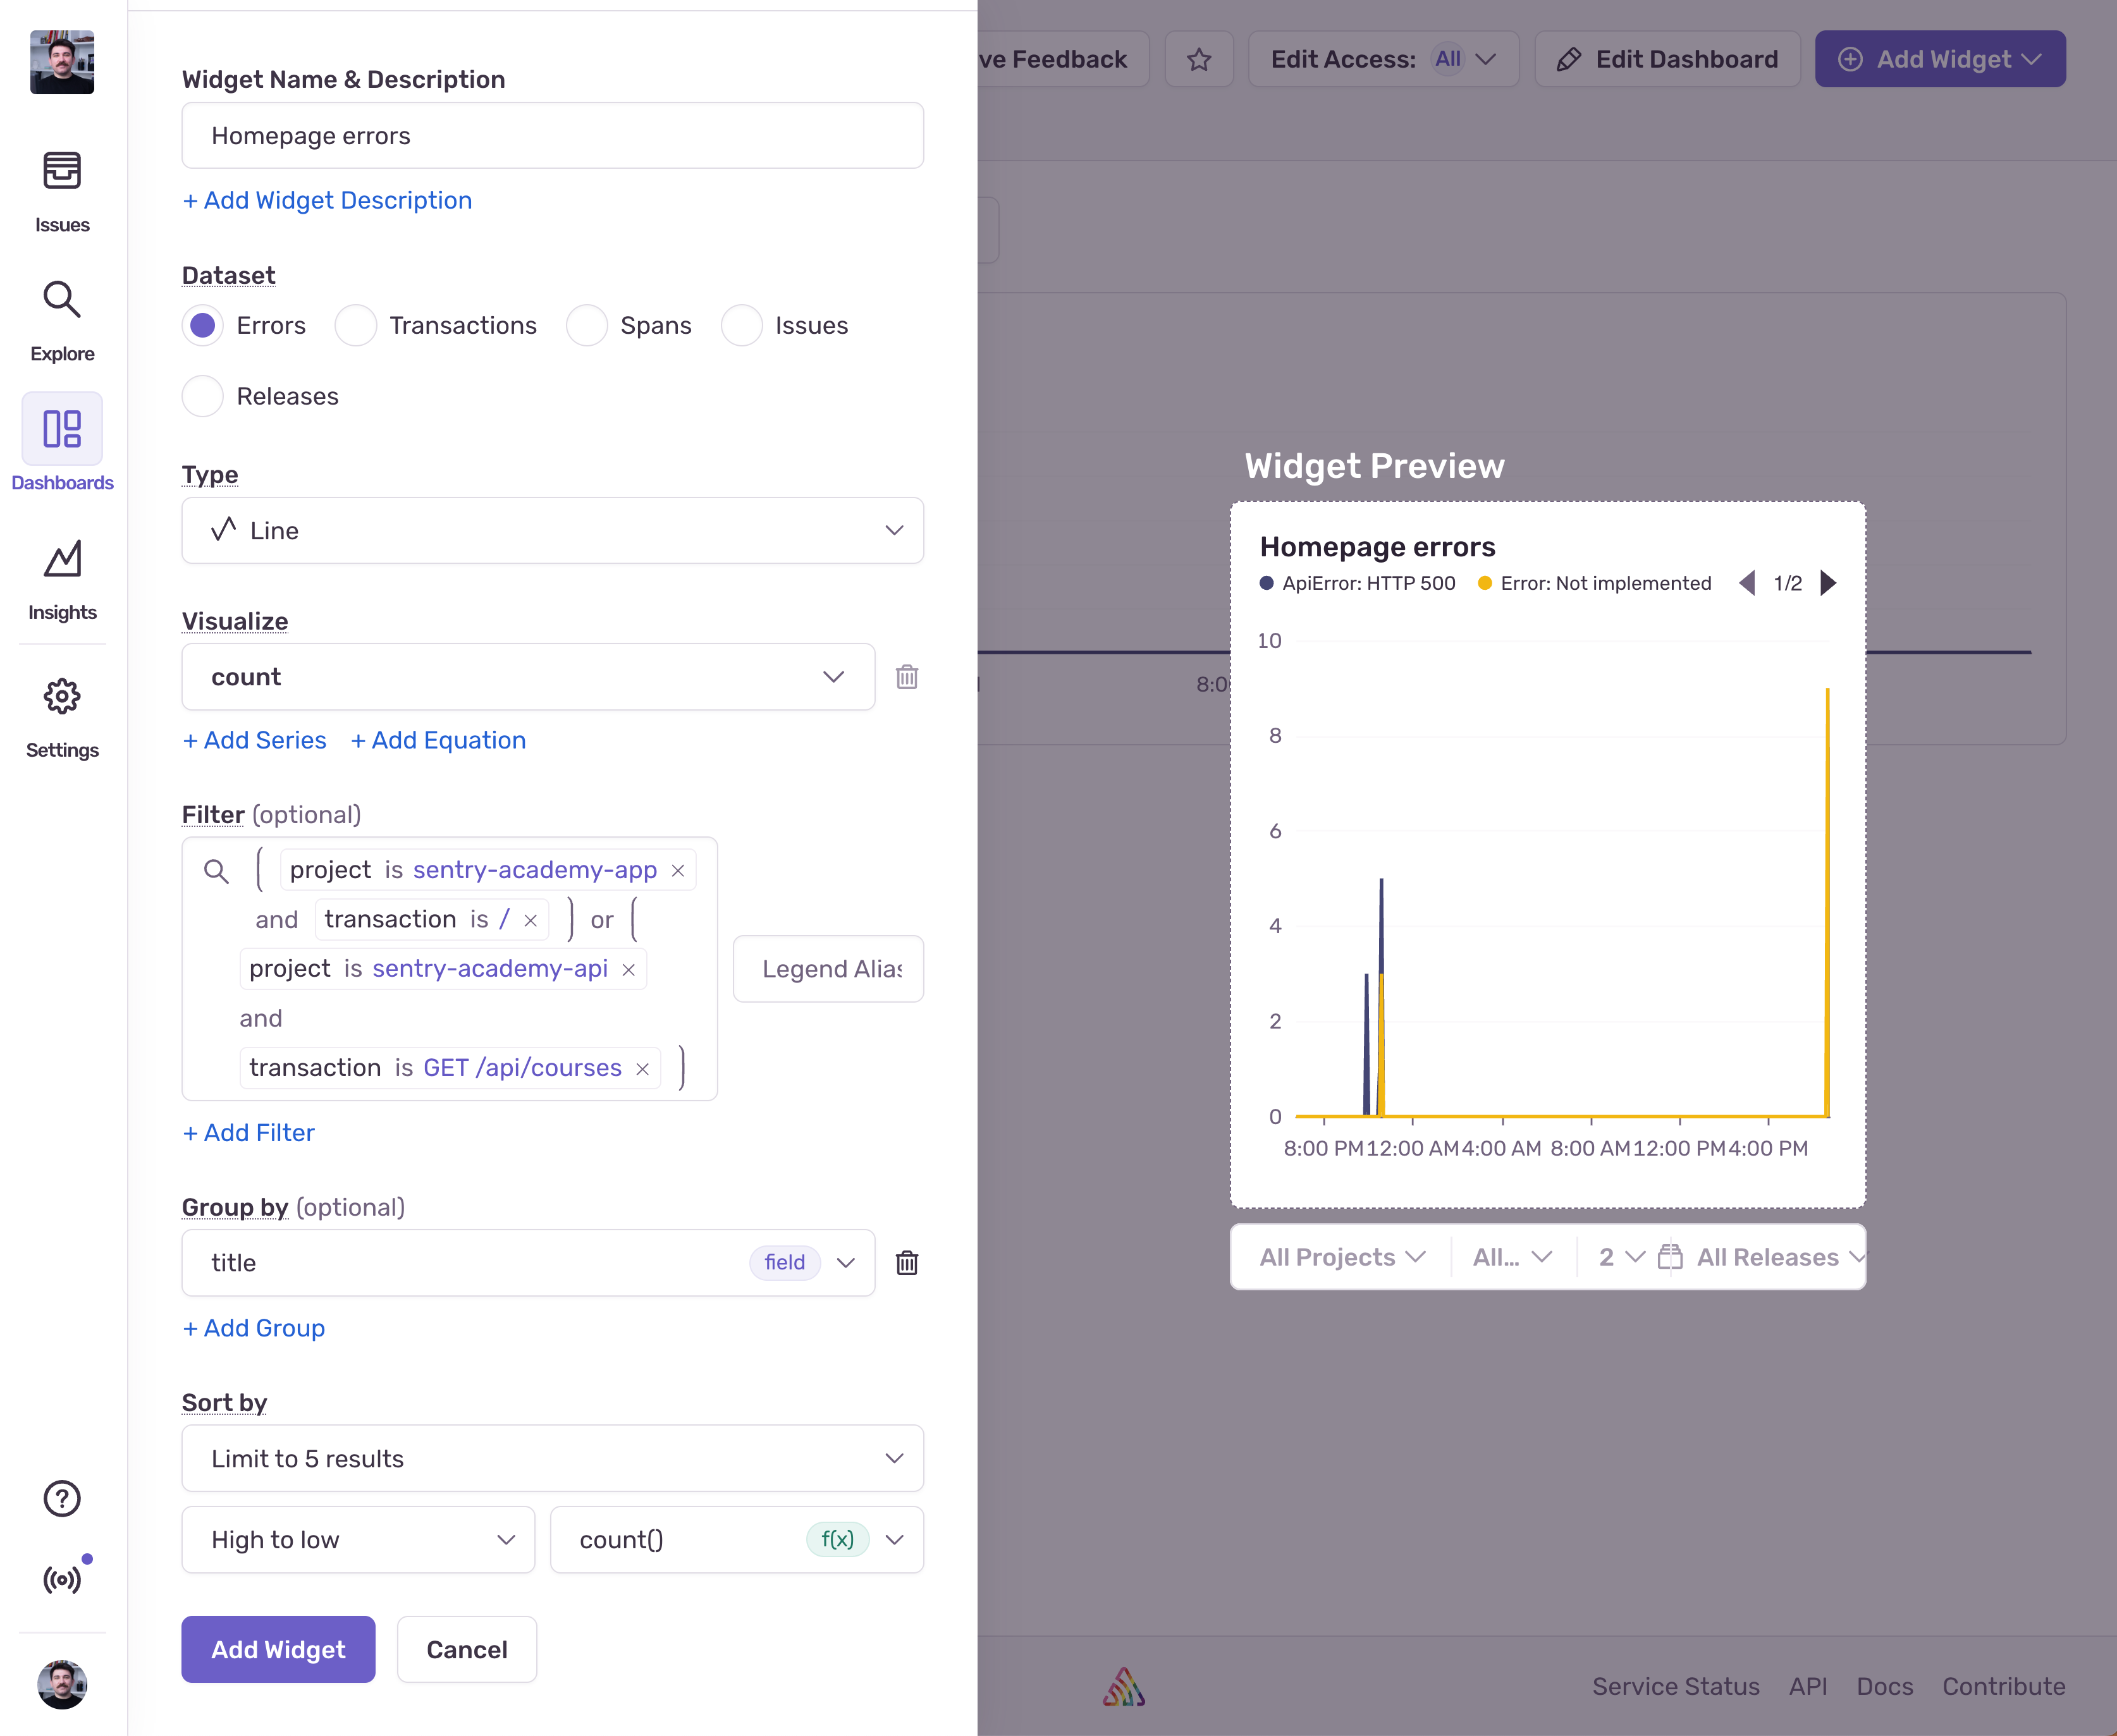
- Set the name of the widget to something like “Homepage Errors”
- Make sure the Dataset is set to “Errors”
- Leave the type as “Line”, or you can also try “Bar”
- Set the visualization to “count”
- The filter is going to be more verbose this time. We want to track errors both on the client side and the server side. Set the filter to
(project is sentry-academy-app and transaction is /) or (project is sentry-academy-api and transaction is GET /api/courses). - Set the group by to “title”
Hit “Add Widget” and you should see the widget appear on your dashboard. Feel free to click on “Edit Dashboard” and set the width of both Homepage widgets to half width.
3. Courses List Experience Monitoring
The courses list is where users discover and browse available content. Issues here directly impact course enrollment and user engagement.
-
Courses List Performance Monitoring This time instead of tracking the LCP metric, we’ll track a custom metric that measures the time it takes to receive the courses from the API. But first, we need to create the custom metric.
Open the
CoursesPage.tsxfile and locate the line where we fetch the courses from the API:const getCategories = useCallback(() => api.courses.getCategories(), []);Earlier we learned how to create custom spans in Sentry, so let’s create a span that wraps the body of the
useCallbackcallback:const getCategories = useCallback(() => Sentry.startSpan({ name: 'all-courses-content-load', op: 'cx' }, () => api.courses.getCategories()), []);We’ll set the span name to
all-courses-content-loadand the operation tocx. Thecxoperation is not a special operation, it’s just a way to identify the span as a critical experience span, that’s all.With this in place, let’s create the widget:
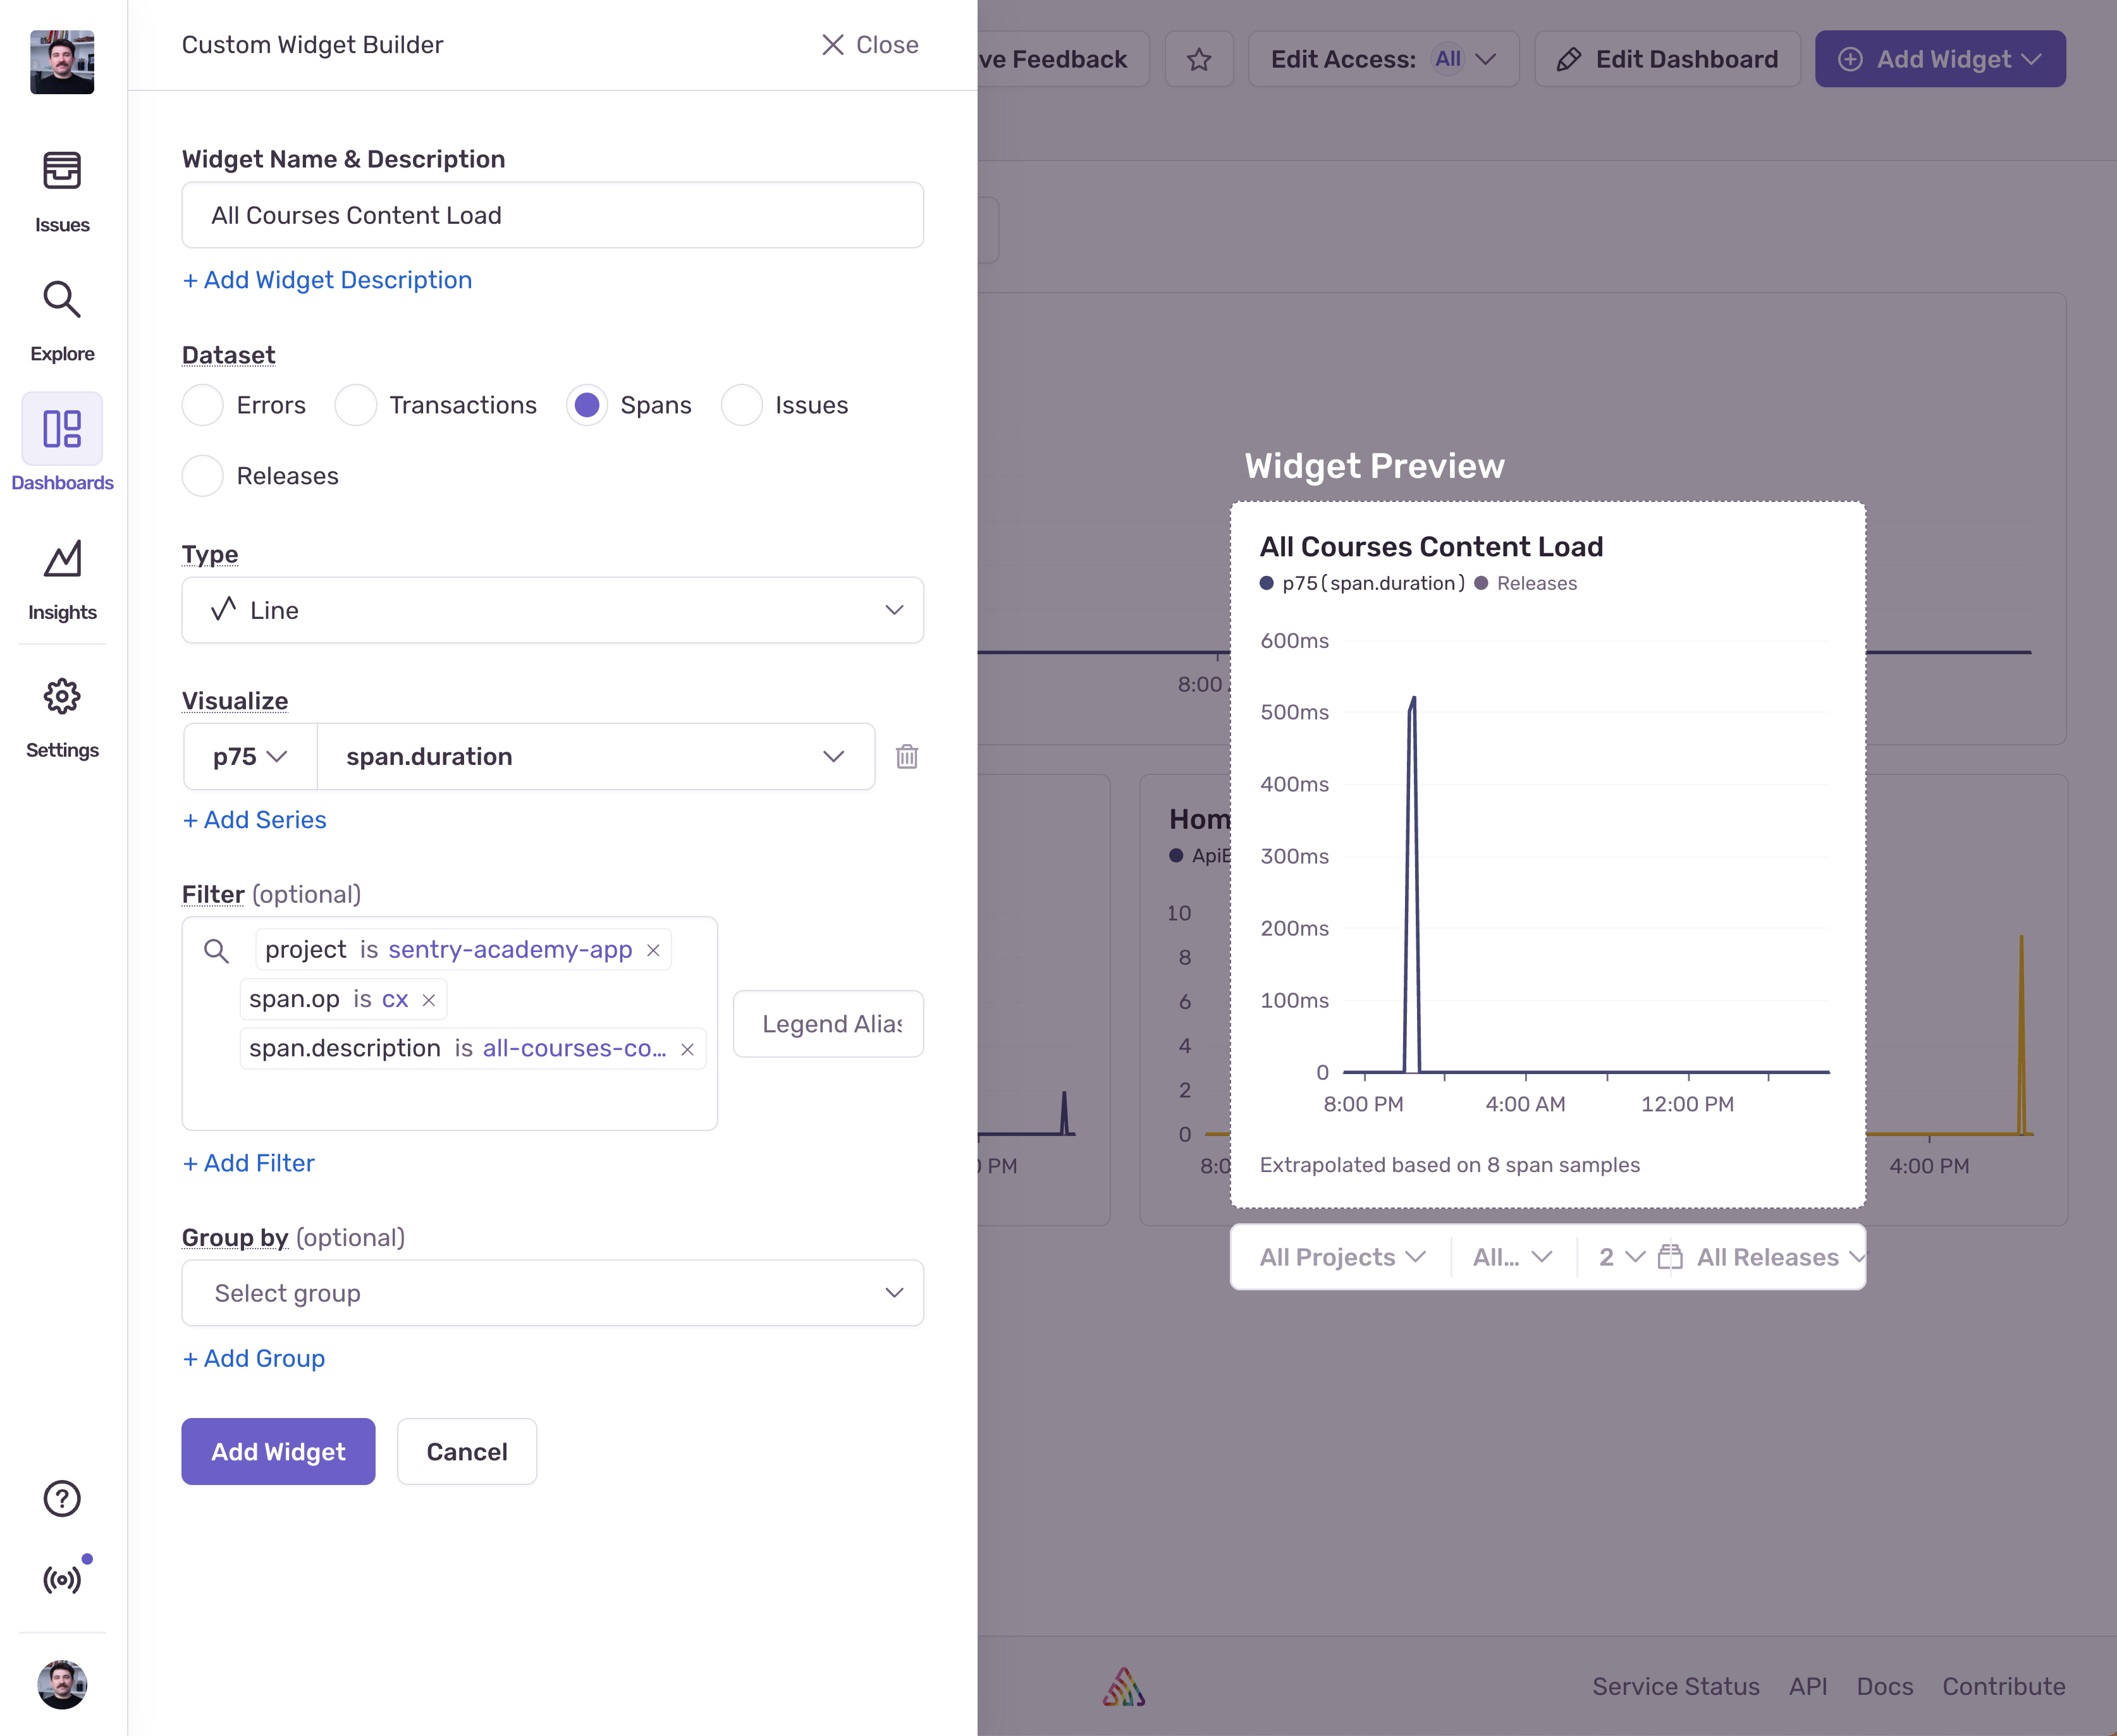
- Set the name of the widget to something like “All Courses Content Load”
- Make sure the Dataset is set to “Spans”
- Leave the type as “Line”
- Set the visualization to
p75andspan.duration - Set the filter to
project is sentry-academy-app,span.op is cx, andspan.description is all-courses-content-load
Hit “Add Widget” and you’ll see the custom metric widget appear on your dashboard. Keep this at a third of the width because we’ll add two more in this row.
-
Courses List Error Monitoring
The great thing about widgets is that we can duplicate them and modify some of their settings. Let’s duplicate the “Homepage errors” widget, go to “Edit Widget” on the three dots, and just modify the Name and Filter to capture errors on the courses page:
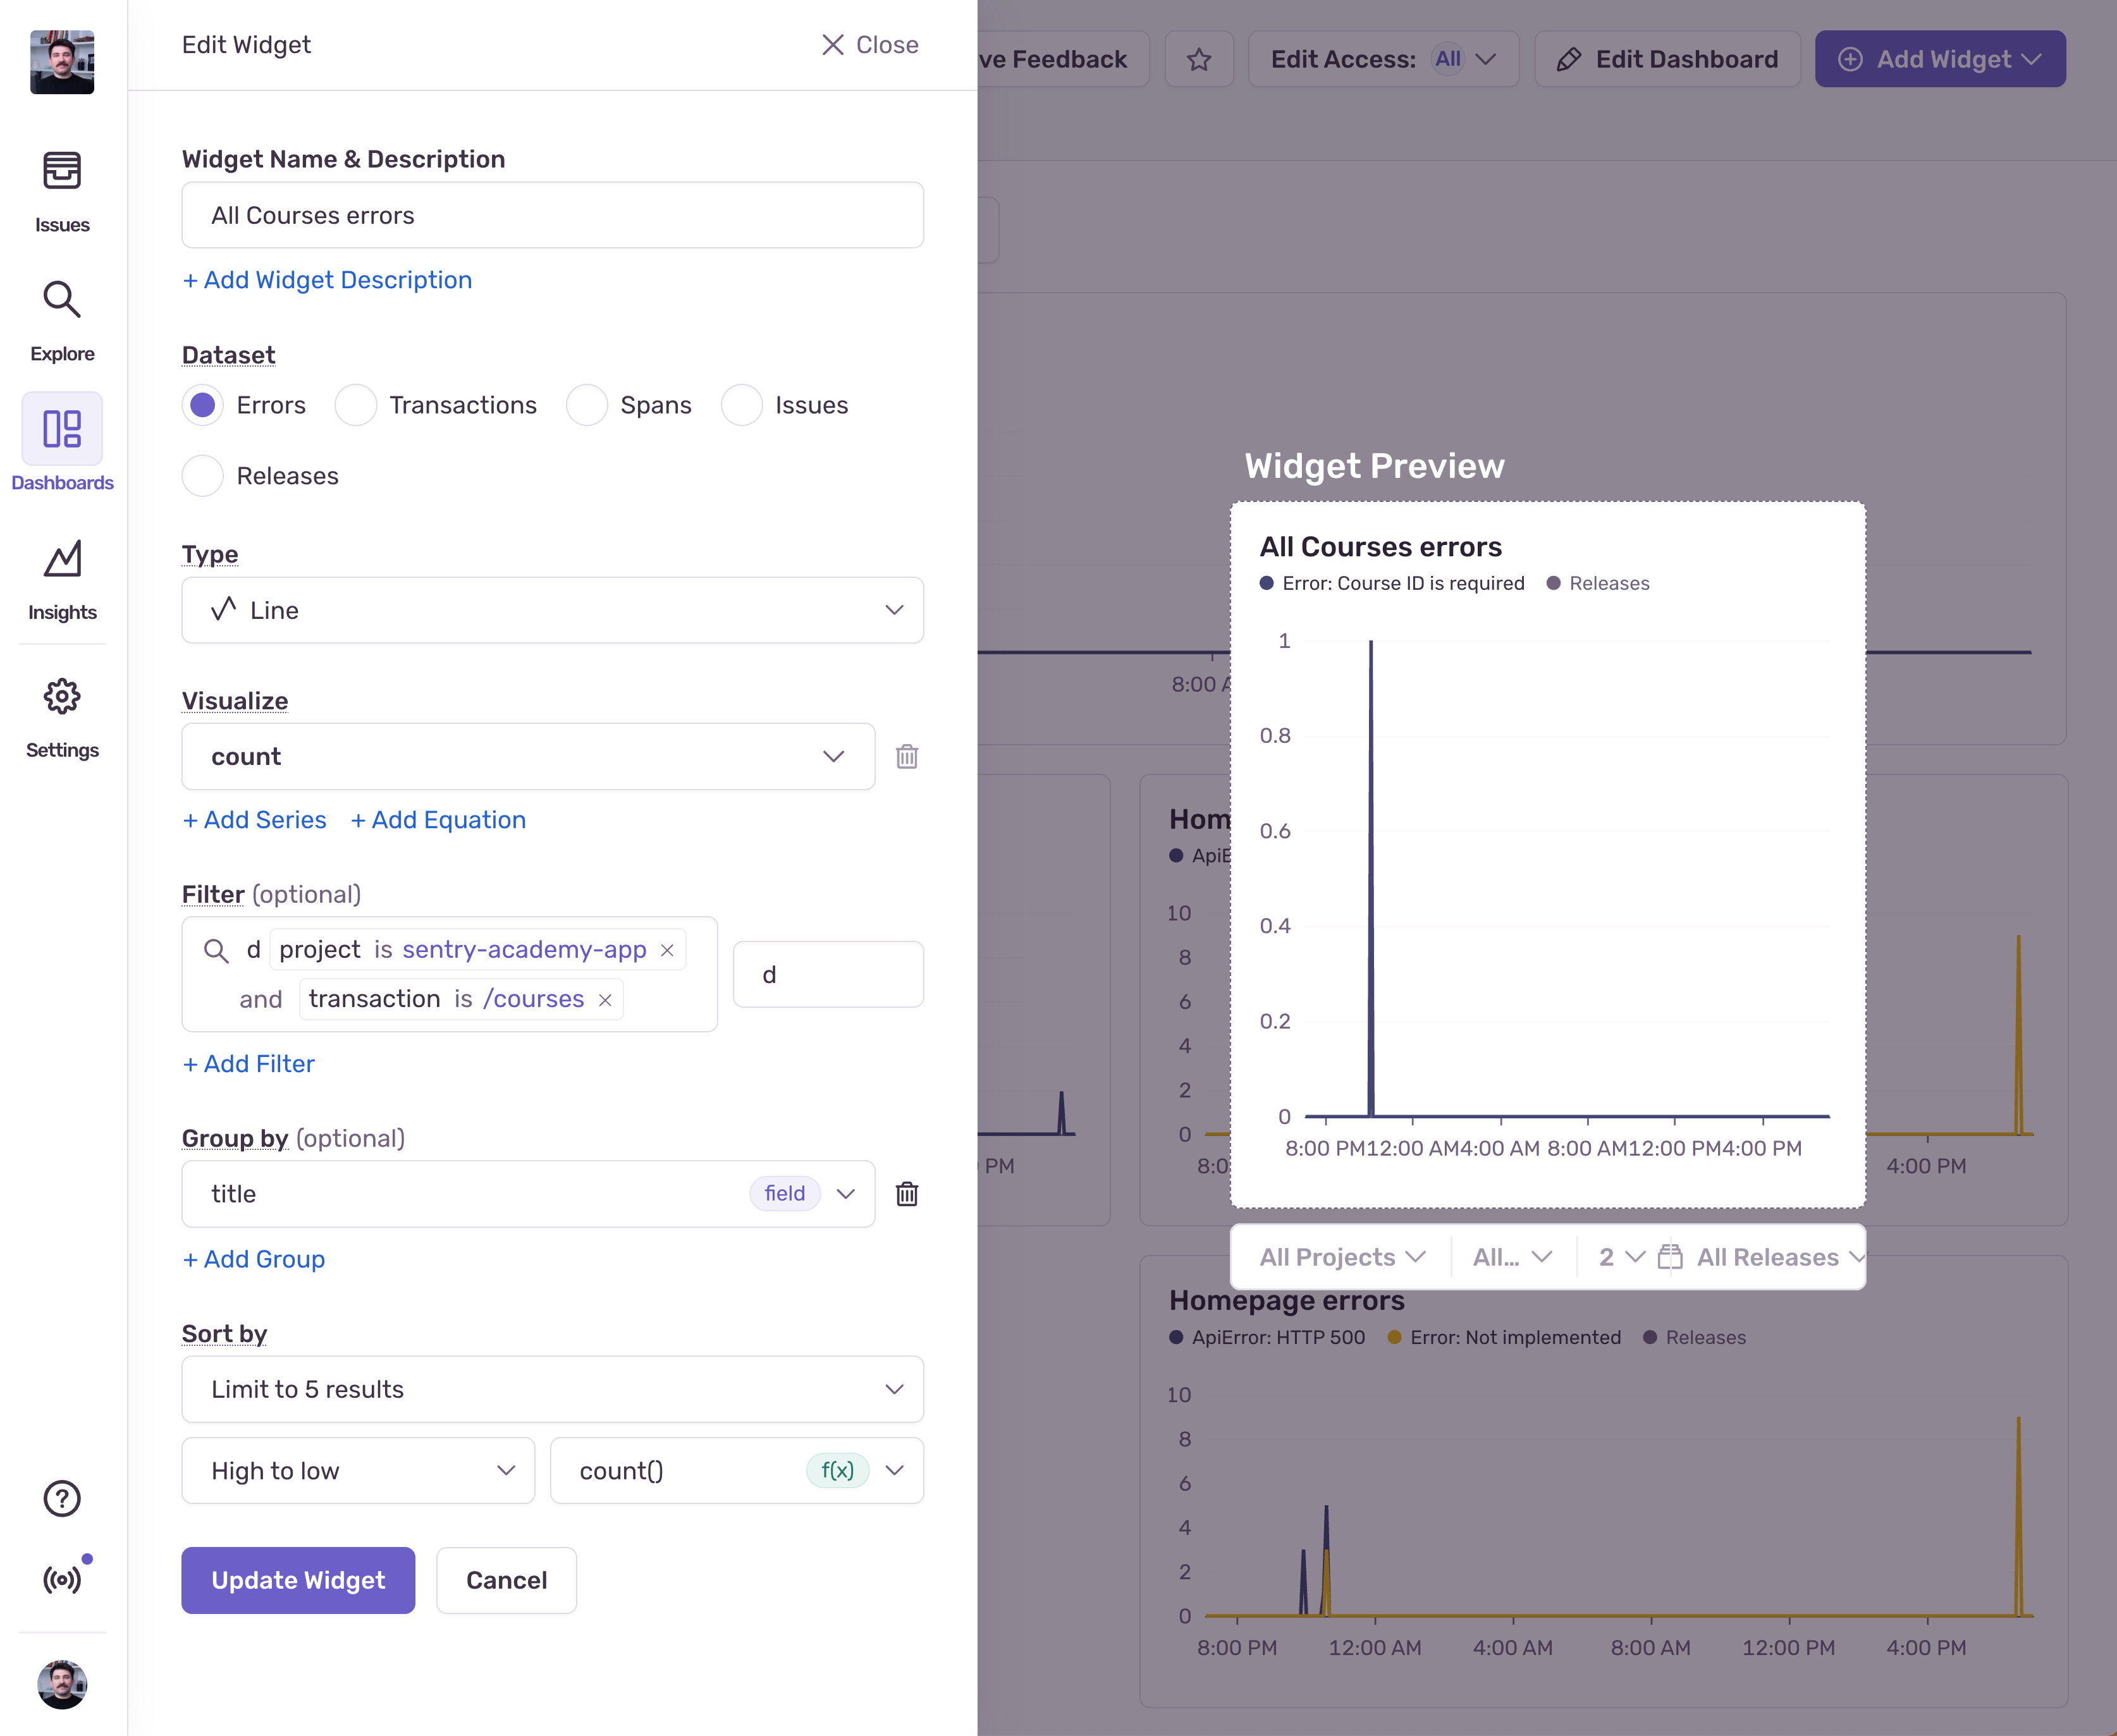
- Set the name to something like “All Courses errors”
- Set the filter to
project is sentry-academy-app and transaction is /courses
Hit “Update Widget” and the widget will reflect the new changes.
-
“Add to Favorites” Custom Metric
We don’t have a custom metric for “Add to Favorites” yet, so let’s create one.
Open the
UserStateContext.tsxfile and locate thetoggleFavoritefunction. Wrap the body of the function in aSentry.startSpancall:const toggleFavorite = useCallback((course: Course): void => {...Sentry.startSpan({ name: 'toggle-favorite', op: 'cx' }, () => {setProfile(prevProfile => {...});});}, []);We’ll set the span name to
toggle-favoriteand the operation tocx. Now let’s create the widget.This widget is going to be very similar to the “All Courses Content Load” widget, so let’s duplicate that one and modify it:
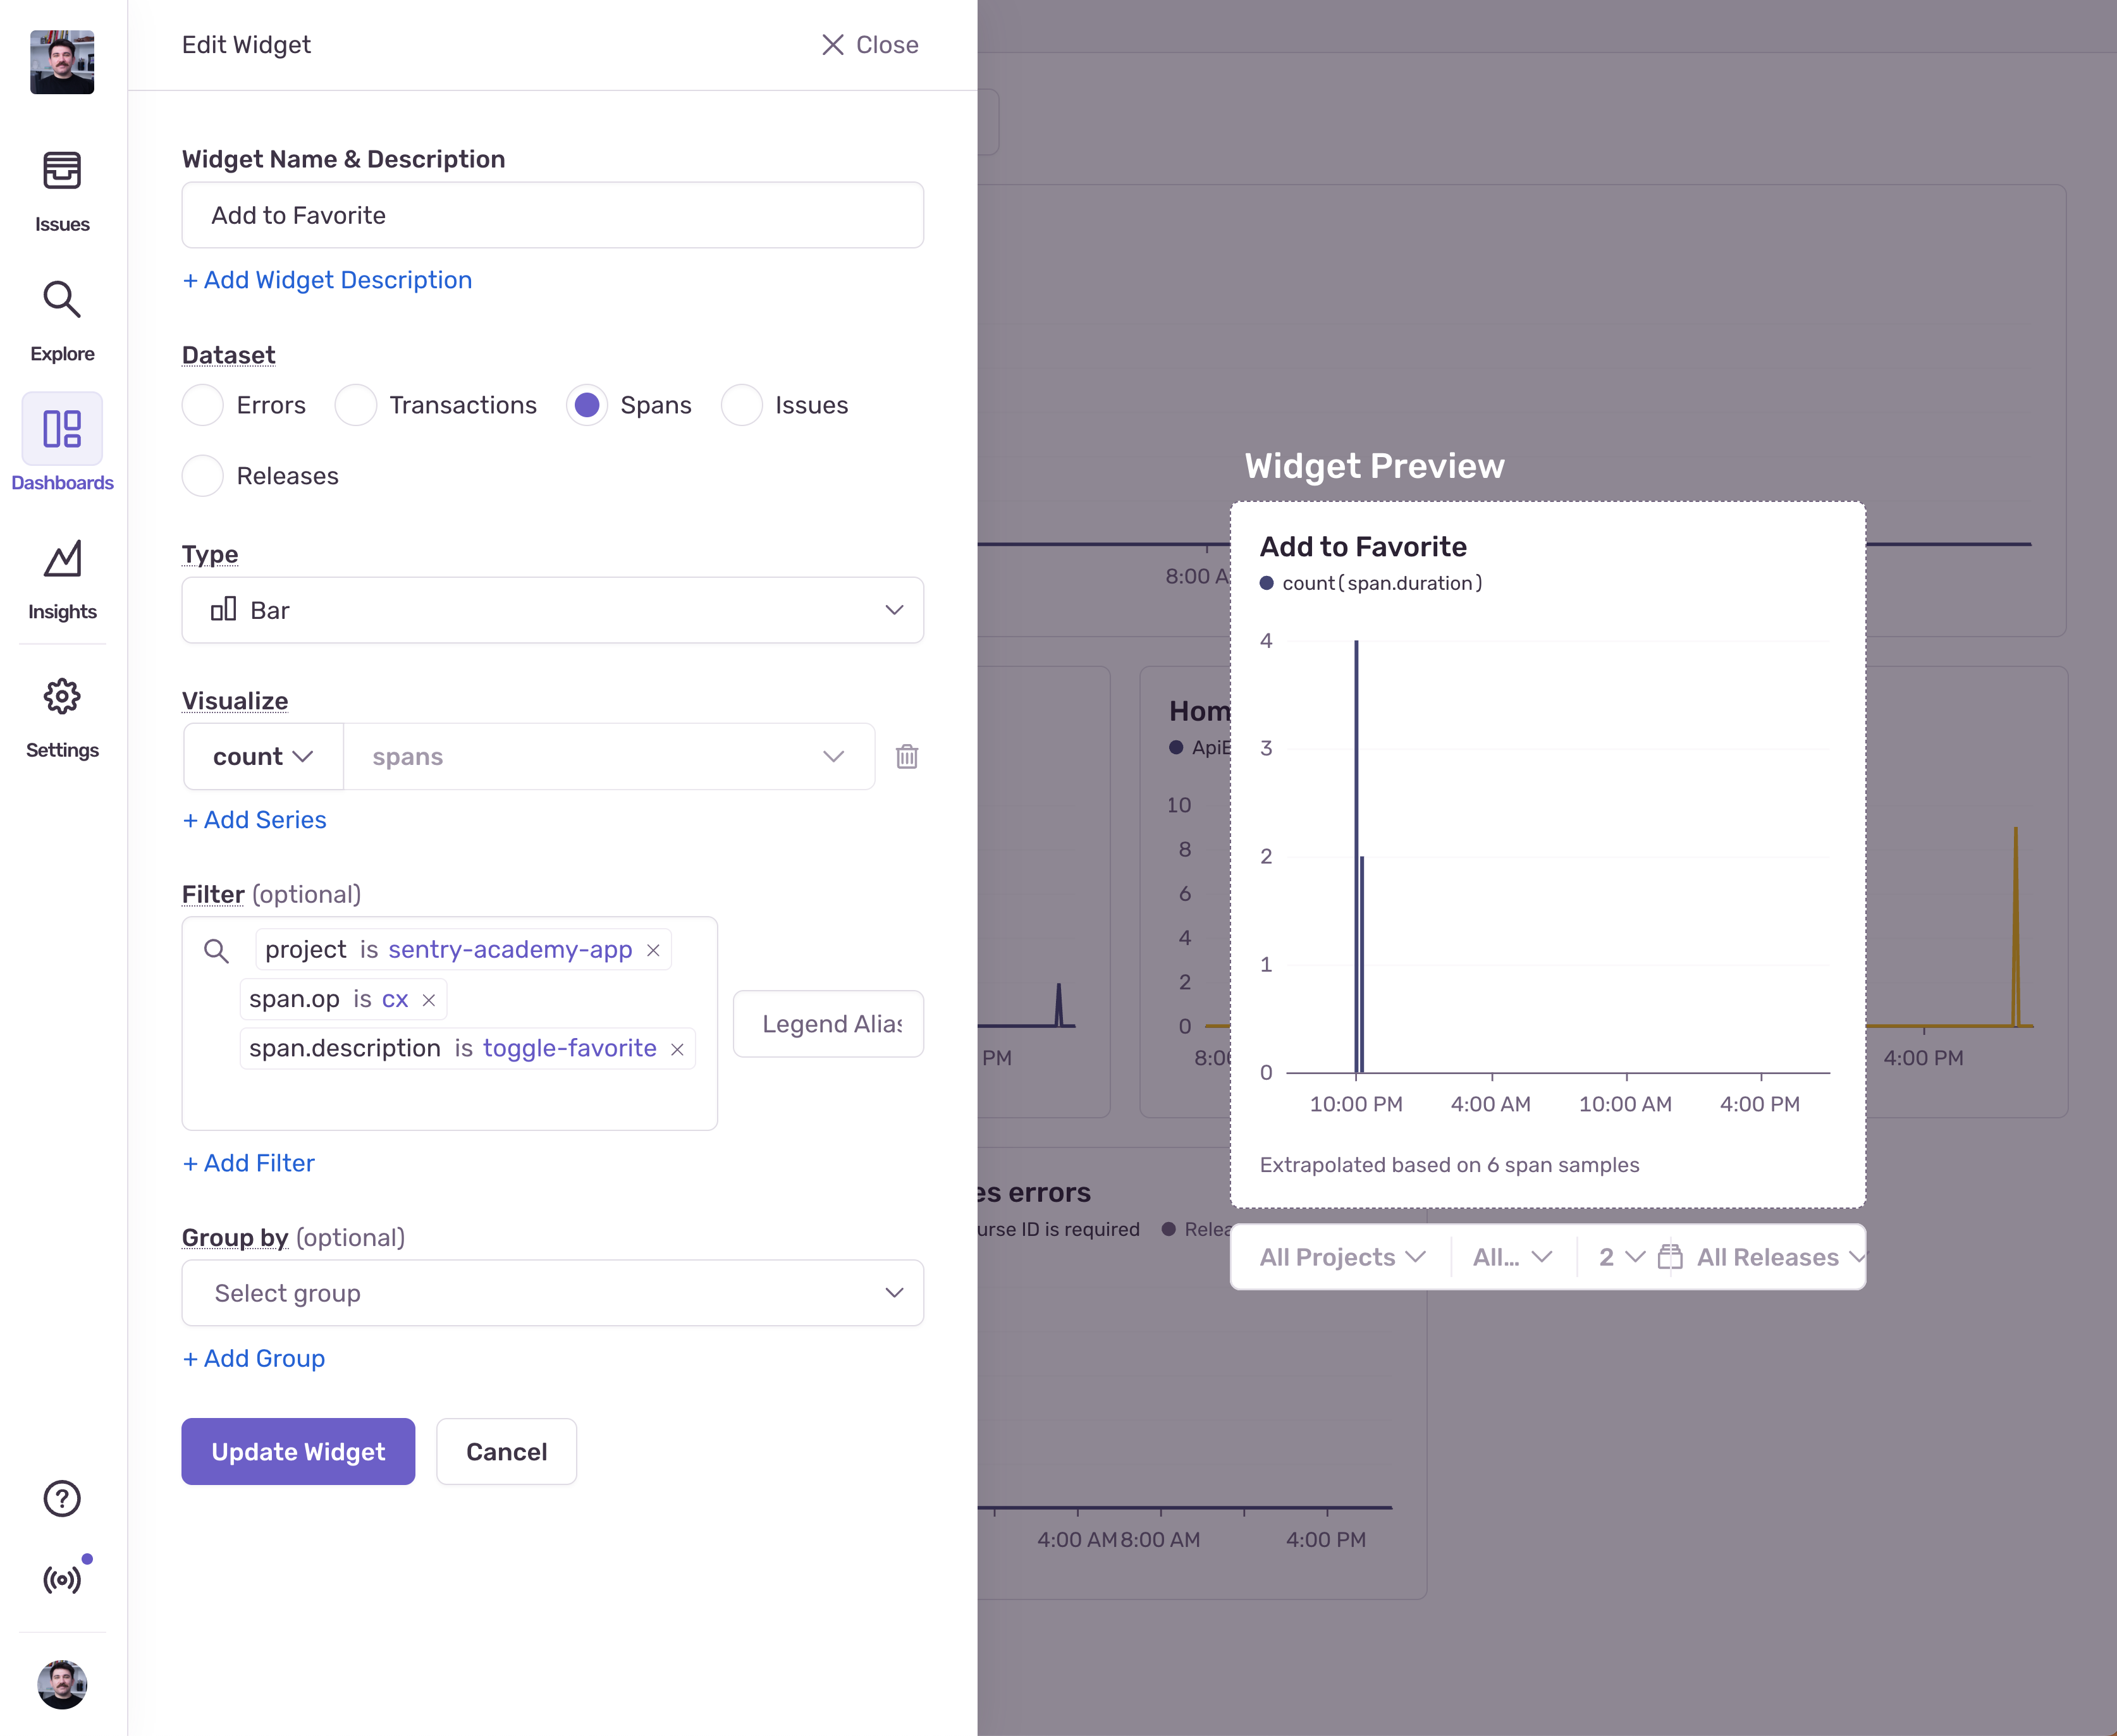
- Set the name of the widget to something like “Add to Favorites”
- Change the type to “Bar”
- Change the visualization to
count - Change the filter to
project is sentry-academy-app,span.op is cx, andspan.description is toggle-favorite
Hit “Update Widget” and you’re set!
4. Course Detail Experience Monitoring
The last step is to monitor the course detail page, more specifically:
- The p75 of a custom
course-details-content-loadspan - The error rate on the course details page
- The
countof a custombookmarkspan
I’ll let you do this one on your own. The widgets are going to be very similar to the last three widgets we created, so what you should do:
- Add the missing
course-details-content-loadspan to theCourseDetailPage.tsxfile - Add the missing
bookmarkspan to theCourseDetailPage.tsxfile in thetoggleBookmarkfunction - Duplicate the last three widgets and modify them accordingly
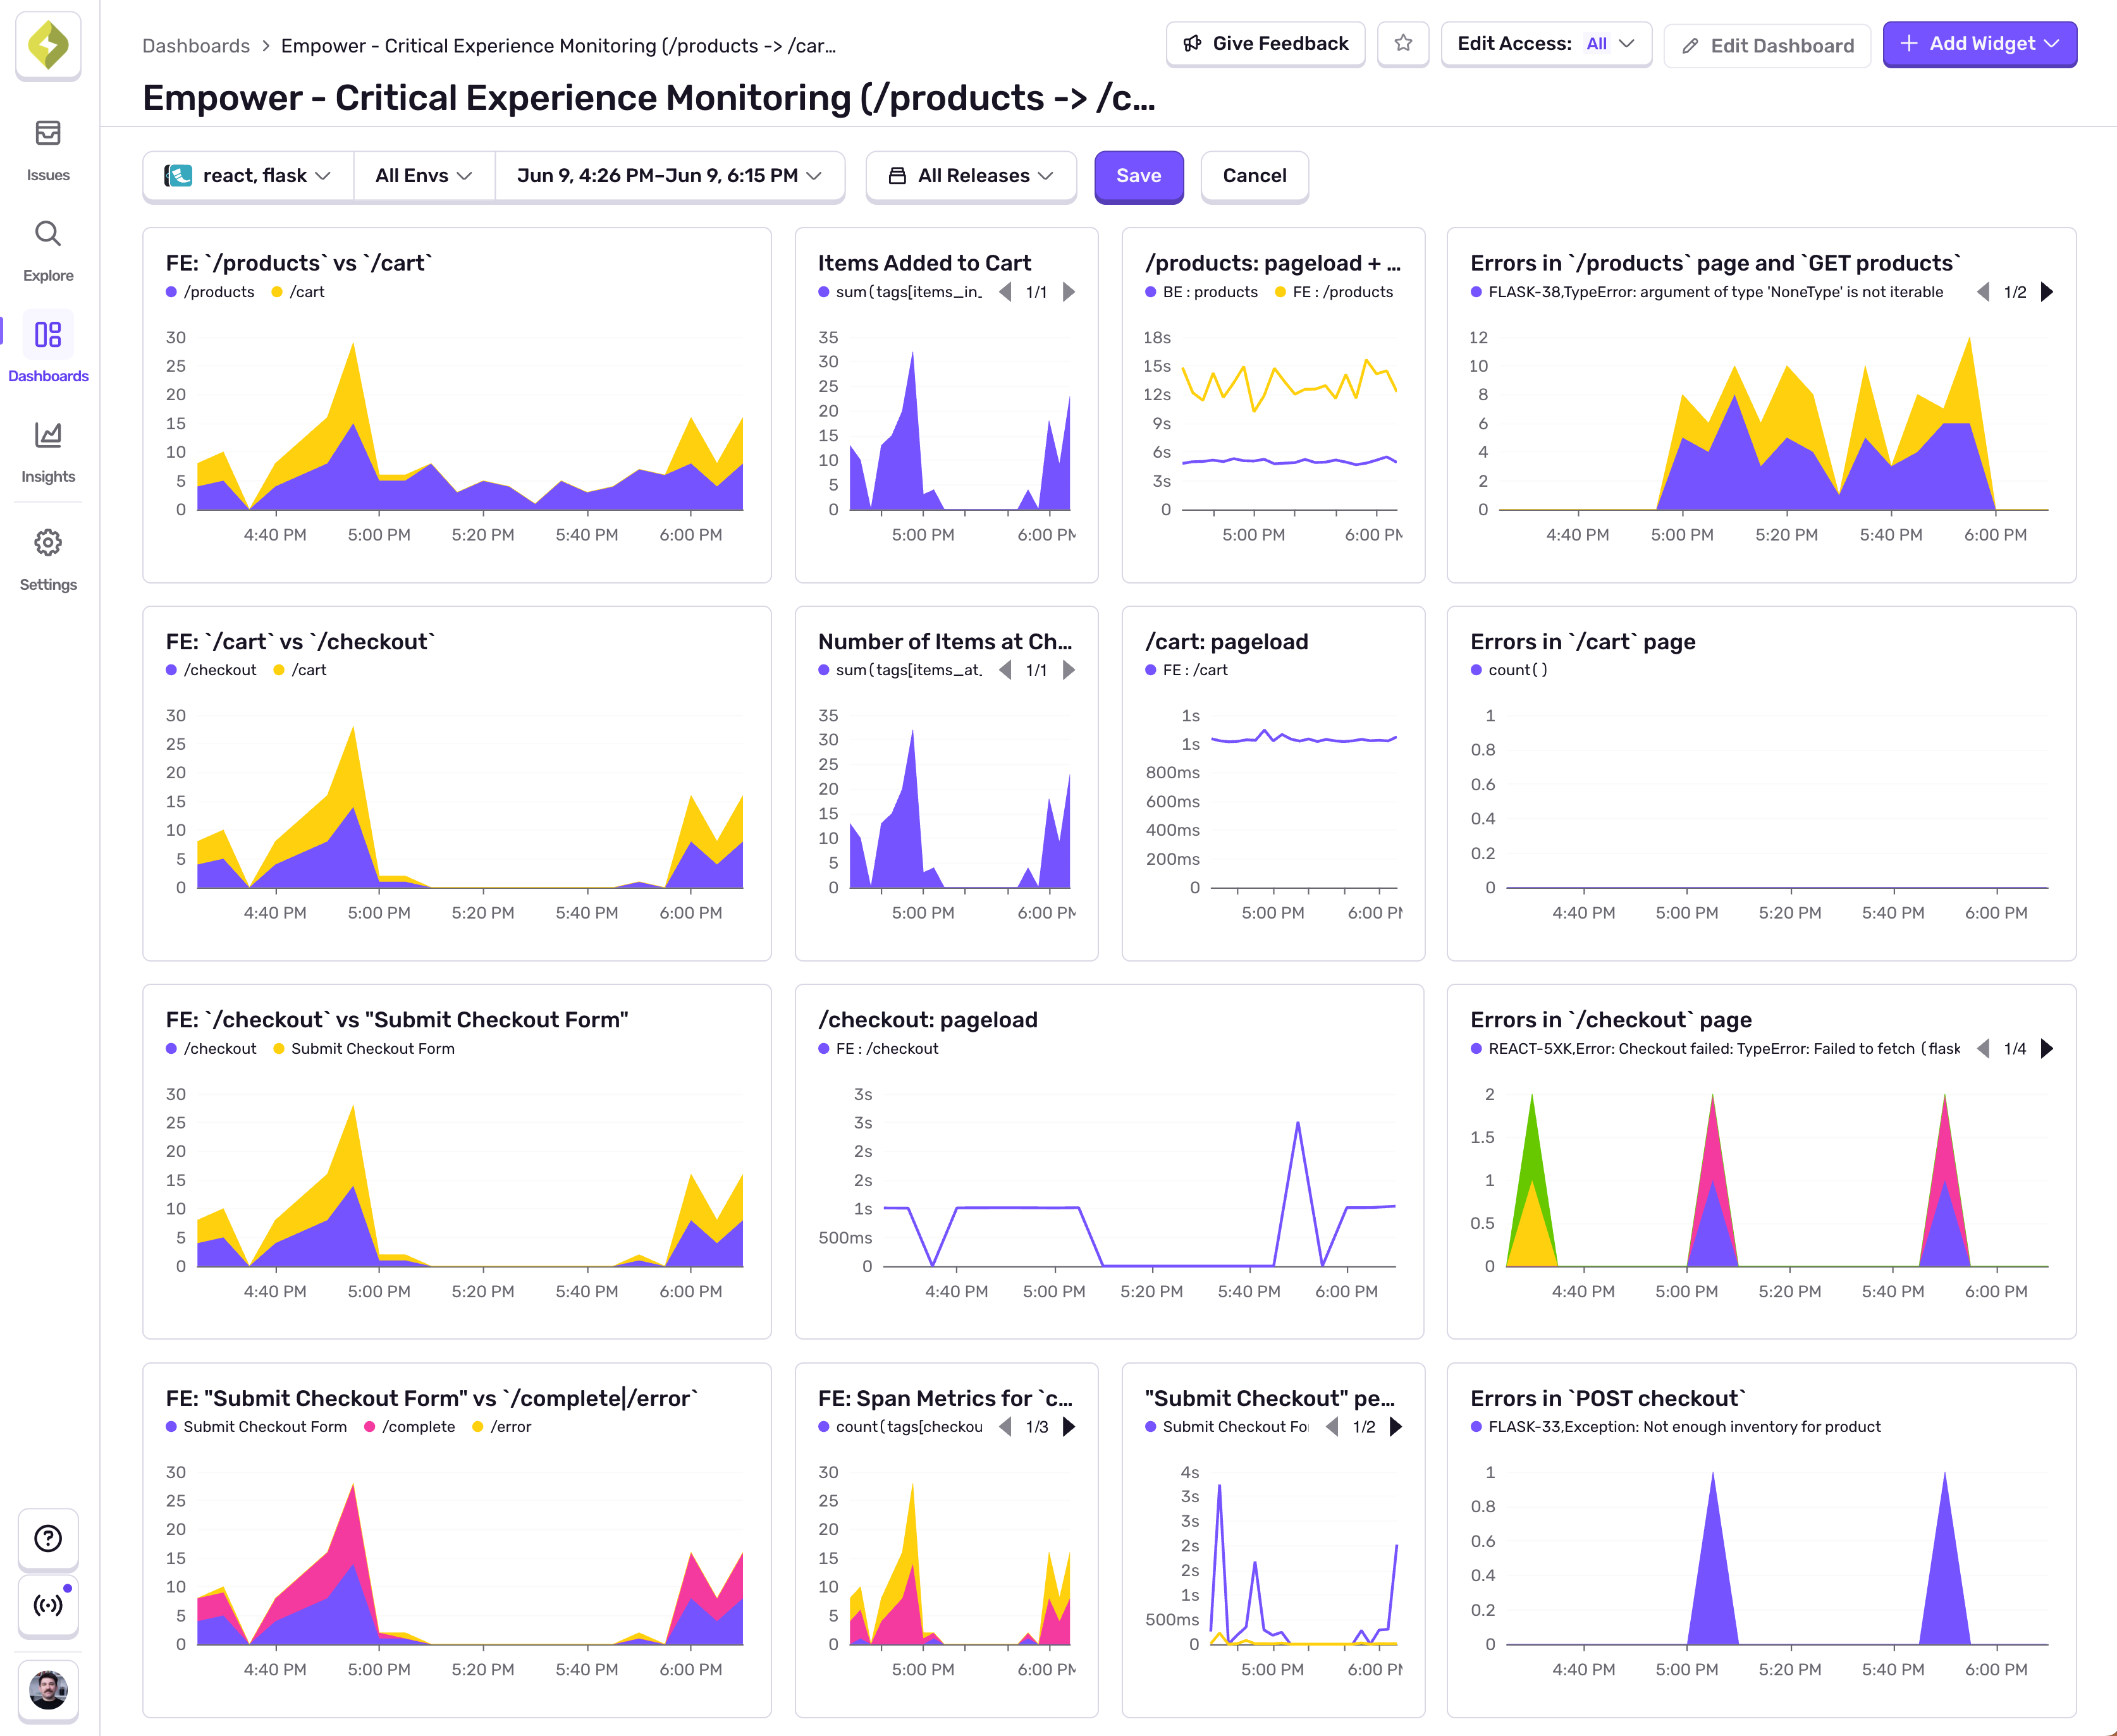
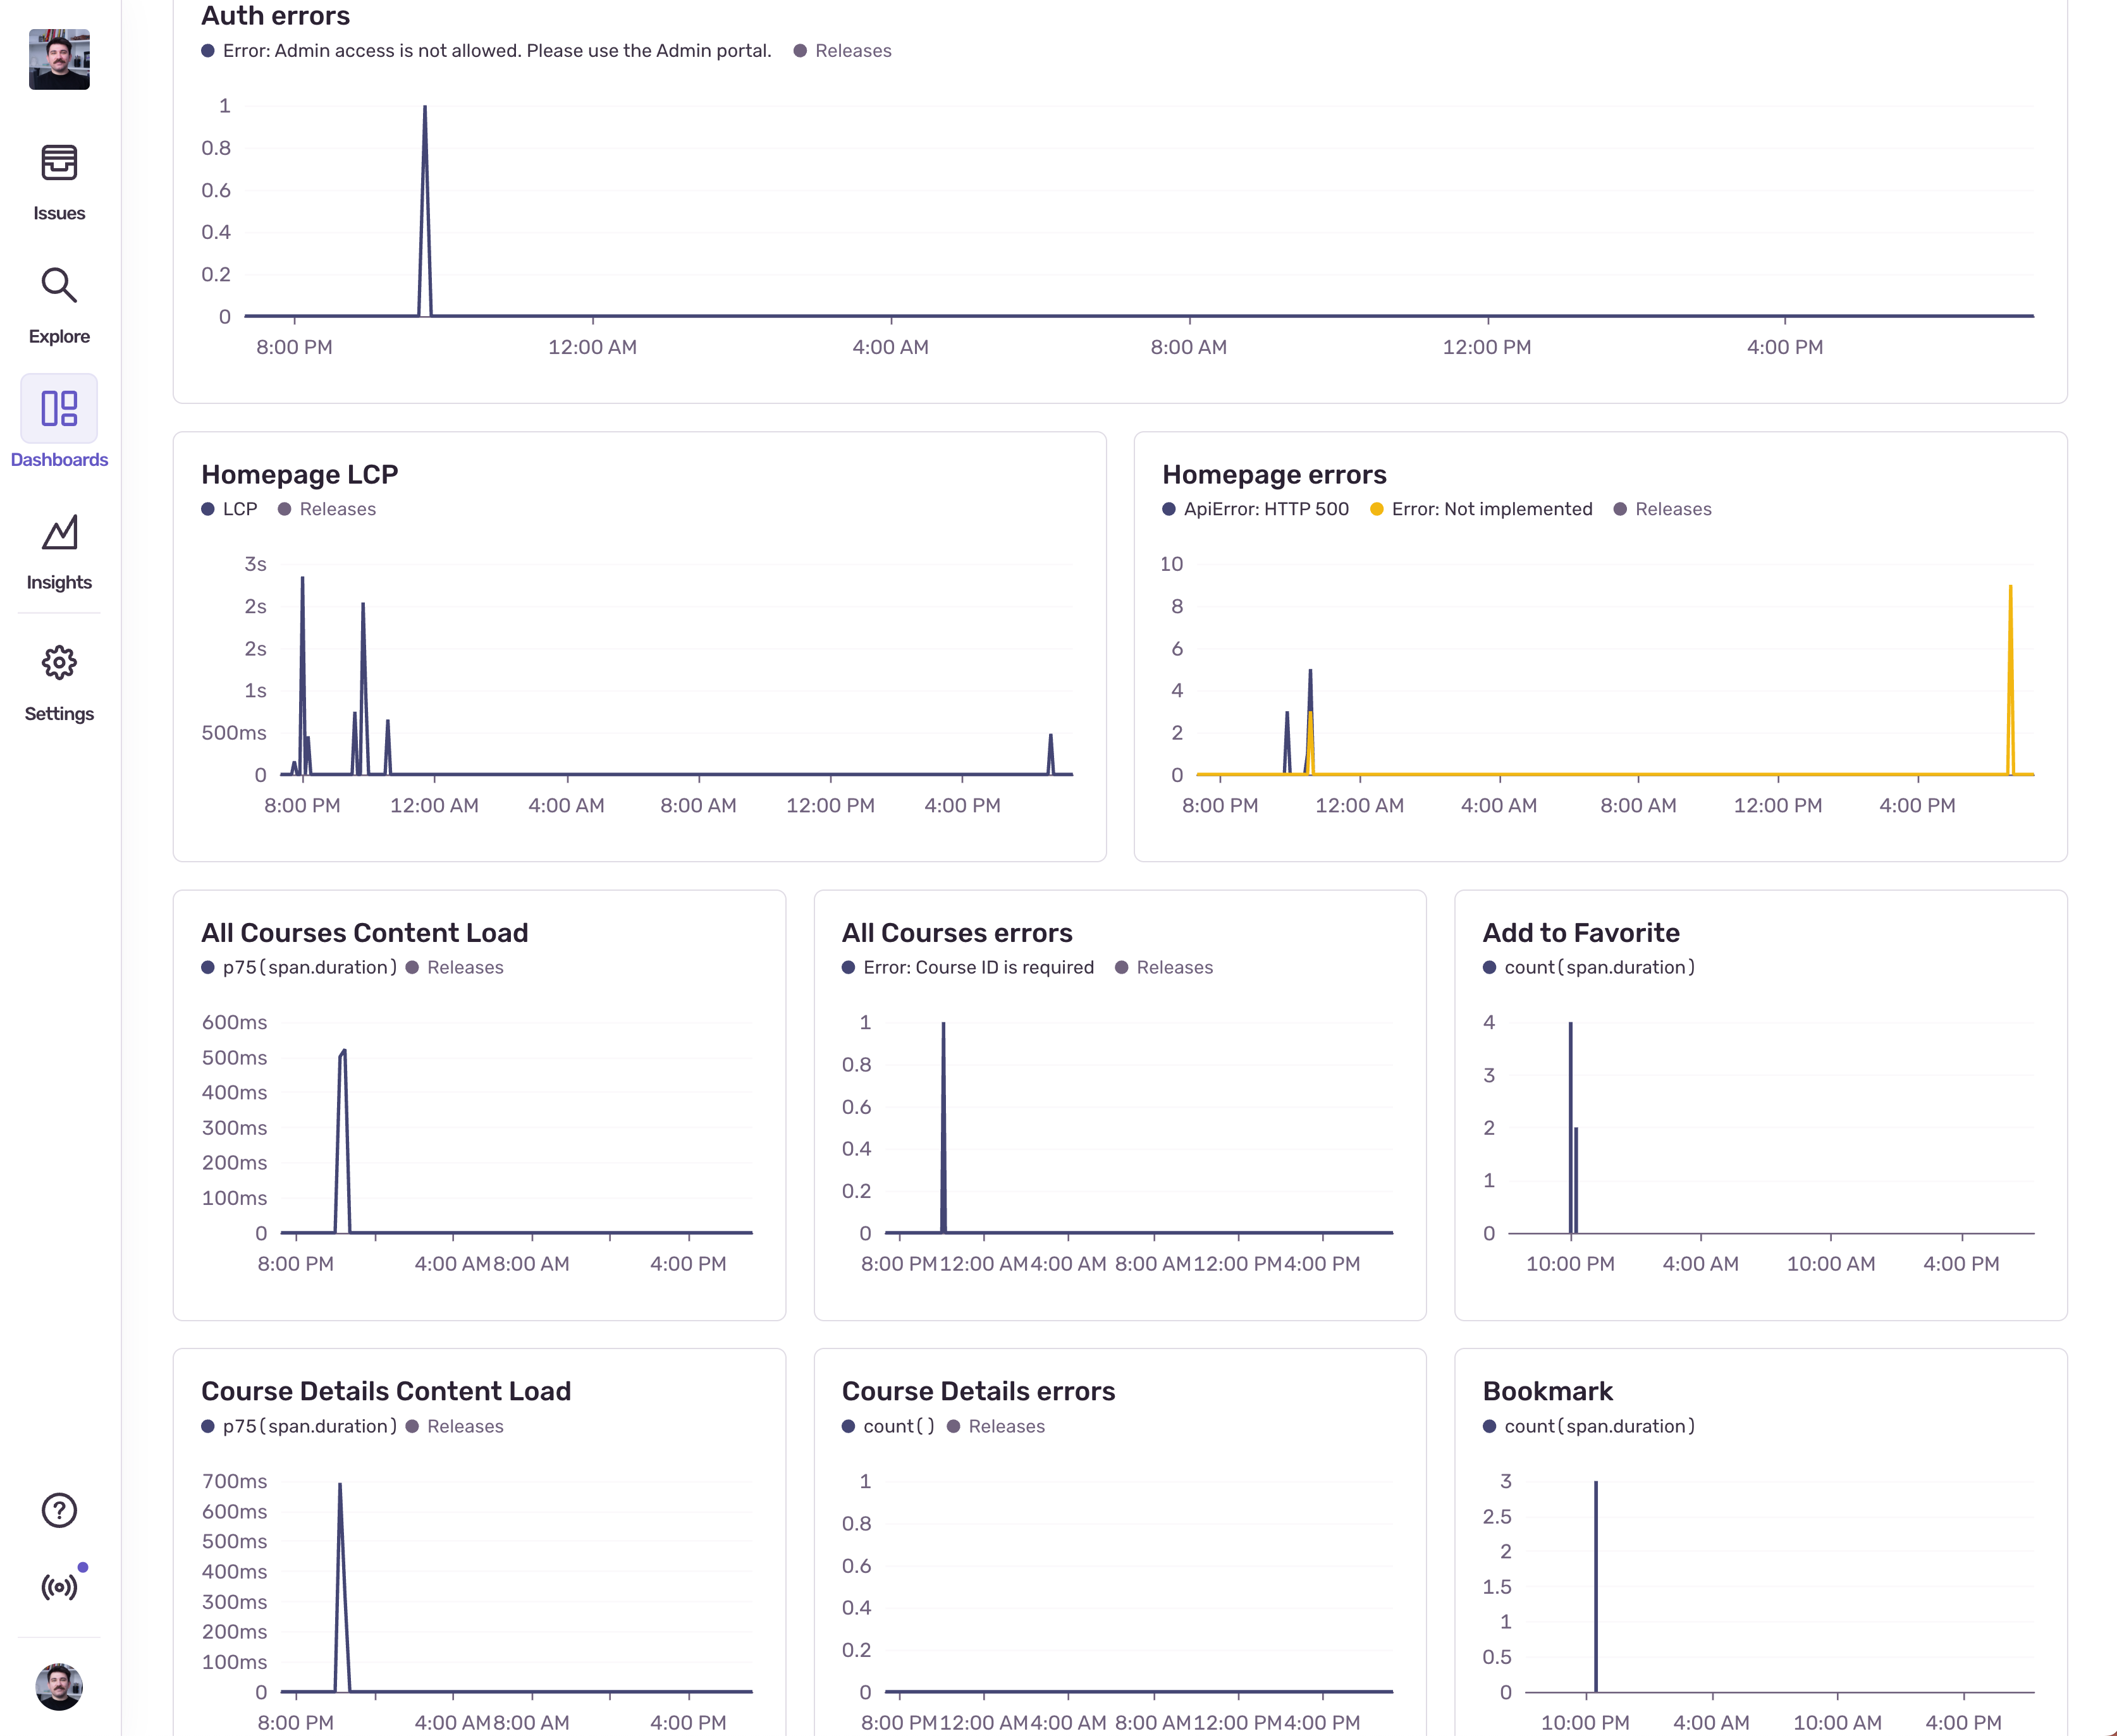
When you’re done, you should have a dashboard that looks like this:
Next Steps
With Critical Experience monitoring in place, you now have visibility into the user flows that matter most to your business. Use this data to:
- Prioritize Engineering Efforts: Focus on issues that impact business-critical flows
- Measure Business Impact: Connect technical performance to business outcomes
- Proactive Issue Resolution: Address problems before they significantly impact users
- Optimize User Experience: Use CX data to guide UX and performance improvements
It’s important to note that you can create alerts based on each of the widgets we created. If you open a widget’s menu, the first option would be either “Open in Discover” or “Open in Explore”. Both Discover and Explore pages offer an option to create an alert of the current state.
Continue monitoring your Critical Experiences and iterating on your dashboards and alerts as your application and business priorities evolve.